Bussiness
The Overextended Stock Market Has Likely Reached Its Breaking Point

Robert Daly/OJO Images via Getty Images
The S&P 500 has hit multiple extremes that scream danger. This index is technically overextended and fundamentally overvalued but close to a breaking point. Much of this has been driven by investors piling into a handful of names, while more recently, a volatility dispersion trade has pushed correlations beyond historical extremes, which is due to unwind as earnings season moves into a higher gear.
Implied Correlation Breaking Down
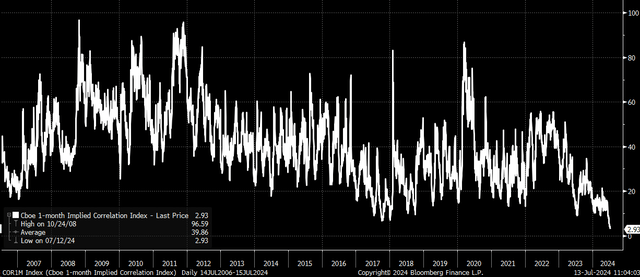
This week, the CBOE 1-month implied correlation index closed below 3. This is by far the lowest closing value in the index’s history, dating back to 2006. A level this low suggests that stocks are trading independently with little relation to changes in the border index.
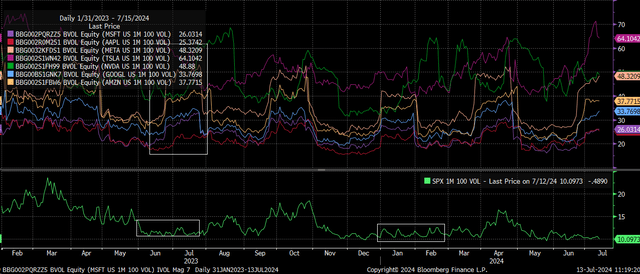
This is likely because we continue to see the 1-month-at-the-month implied volatility levels for many of the Magnificent seven components in the S&P 500 rising. In contrast, the implied volatility level for the S&P 500 continues to trade sideways to lower.
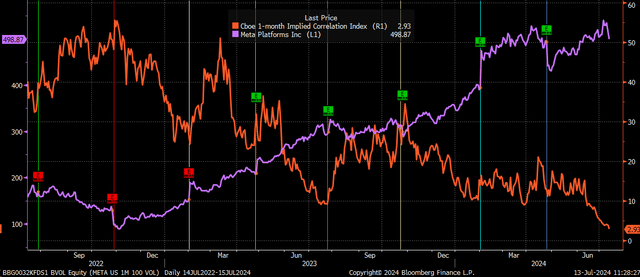
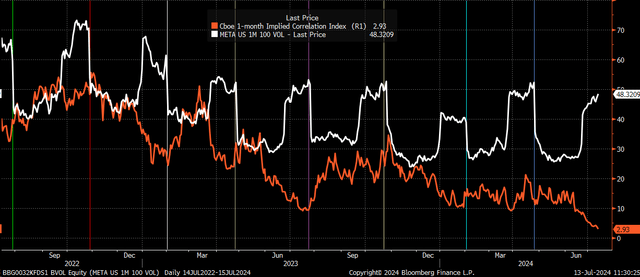
This trade is seasonal, and typically, we see it “revert to the mean” once earnings have passed. As a result, the implied correlation index trends to trade higher as earnings season passes, and implied volatility levels for the stocks in the index begin to drop.
This is because implied volatility levels generally start to rise about one month before earnings season starts, and they drop sharply once the earnings risk has passed. This happens repeatedly, with Meta (META) working as a really strong example.
Volatility Is Very Low
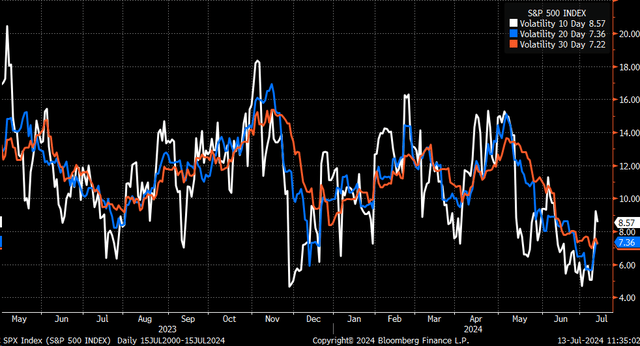
Another potential problem is that realized volatility levels in the S&P 500 have reached really low levels. This has meant that all of the fluctuation this past week, even though relatively minor over the longer term, has helped to push ten- and 20-day levels of realized volatility up, which will result in longer-date levels of volatility rising as well.
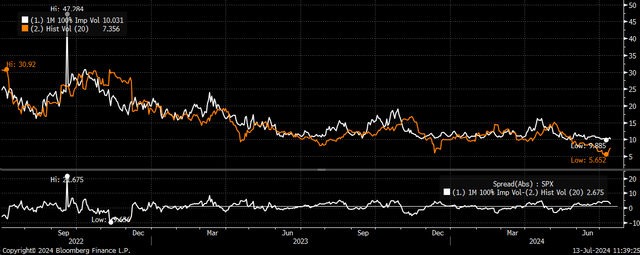
However, climbing realized volatility will generally increase implied volatility risks. Right now, the gap between 20-day realized S&P 500 volatility and implied volatility is around 3, which is higher than the historical average of 1.1 over the past year and a half.
Meanwhile, the VIX options expiration passing this coming Wednesday could also help free up volatility. We currently see a large amount of put gamma built around the 12.5 to 13 level on the VIX options, likely helping to suppress implied volatility.
The key here is that if the tranquility of the S&P 500 over the past few months is giving way to a period of even subtly rising volatility, then it is likely that realized volatility is heading higher from its low levels. Additionally, passing the VIX options expiration could allow volatility to expand this coming week. More importantly, it is coming around a time when the volatility dispersion trade that has pushed correlations to historically low and displaced levels could potentially unwind faster and more violently than usual.
The dispersion trade works by shortening the implied volatility of the index and going long on the volatility of the underlying stocks in the index. So once the implied volatility on the index starts to rise, the short part of the trade will no longer work, and a rising 1-month implied correlation index will be the easiest way to track whether this trade is working or being unwound.
Technically Stretched
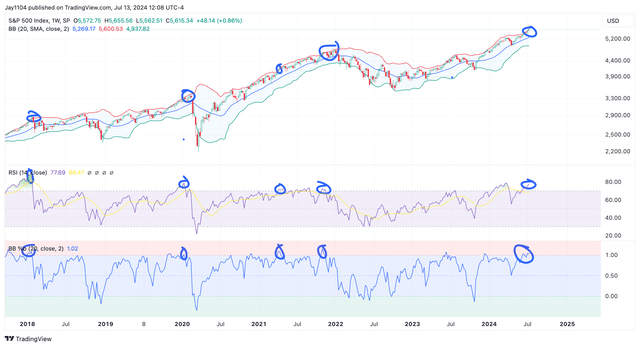
In addition, the S&P 500 is technically stretched, with the relative strength index over 70 on the weekly chart, while also trading above its upper Bollinger band. The two conditions, when combined, have only flashed overbought readings simultaneously five times since 2018, and four of those five times saw sharp pullbacks in the index. The other time, the index traded sideways for several weeks.
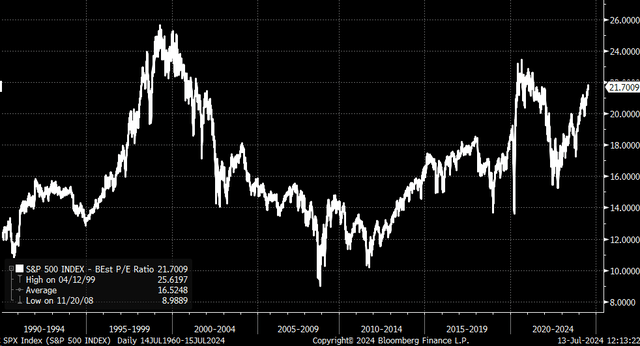
Additionally, the S&P 500 currently trades at 21.7 times its next 12-month earnings estimates, finding itself at the third most expensive level going back to 1990, only trailing the bubble of the late 1990s and the Covid bubble of 2021. Current valuations aren’t that far off the valuations seen in 2021.
The index is faced with a number of rare conditions that suggest valuations, technicals, and volatility are at extreme levels that historically scream caution and care when assessing where this market goes next.




:max_bytes(150000):strip_icc()/roundup-writereditor-loved-deals-tout-f5de51f85de145b2b1eb99cdb7b6cb84.jpg)


