Uncommon Knowledge
Newsweek is committed to challenging conventional wisdom and finding connections in the search for common ground.

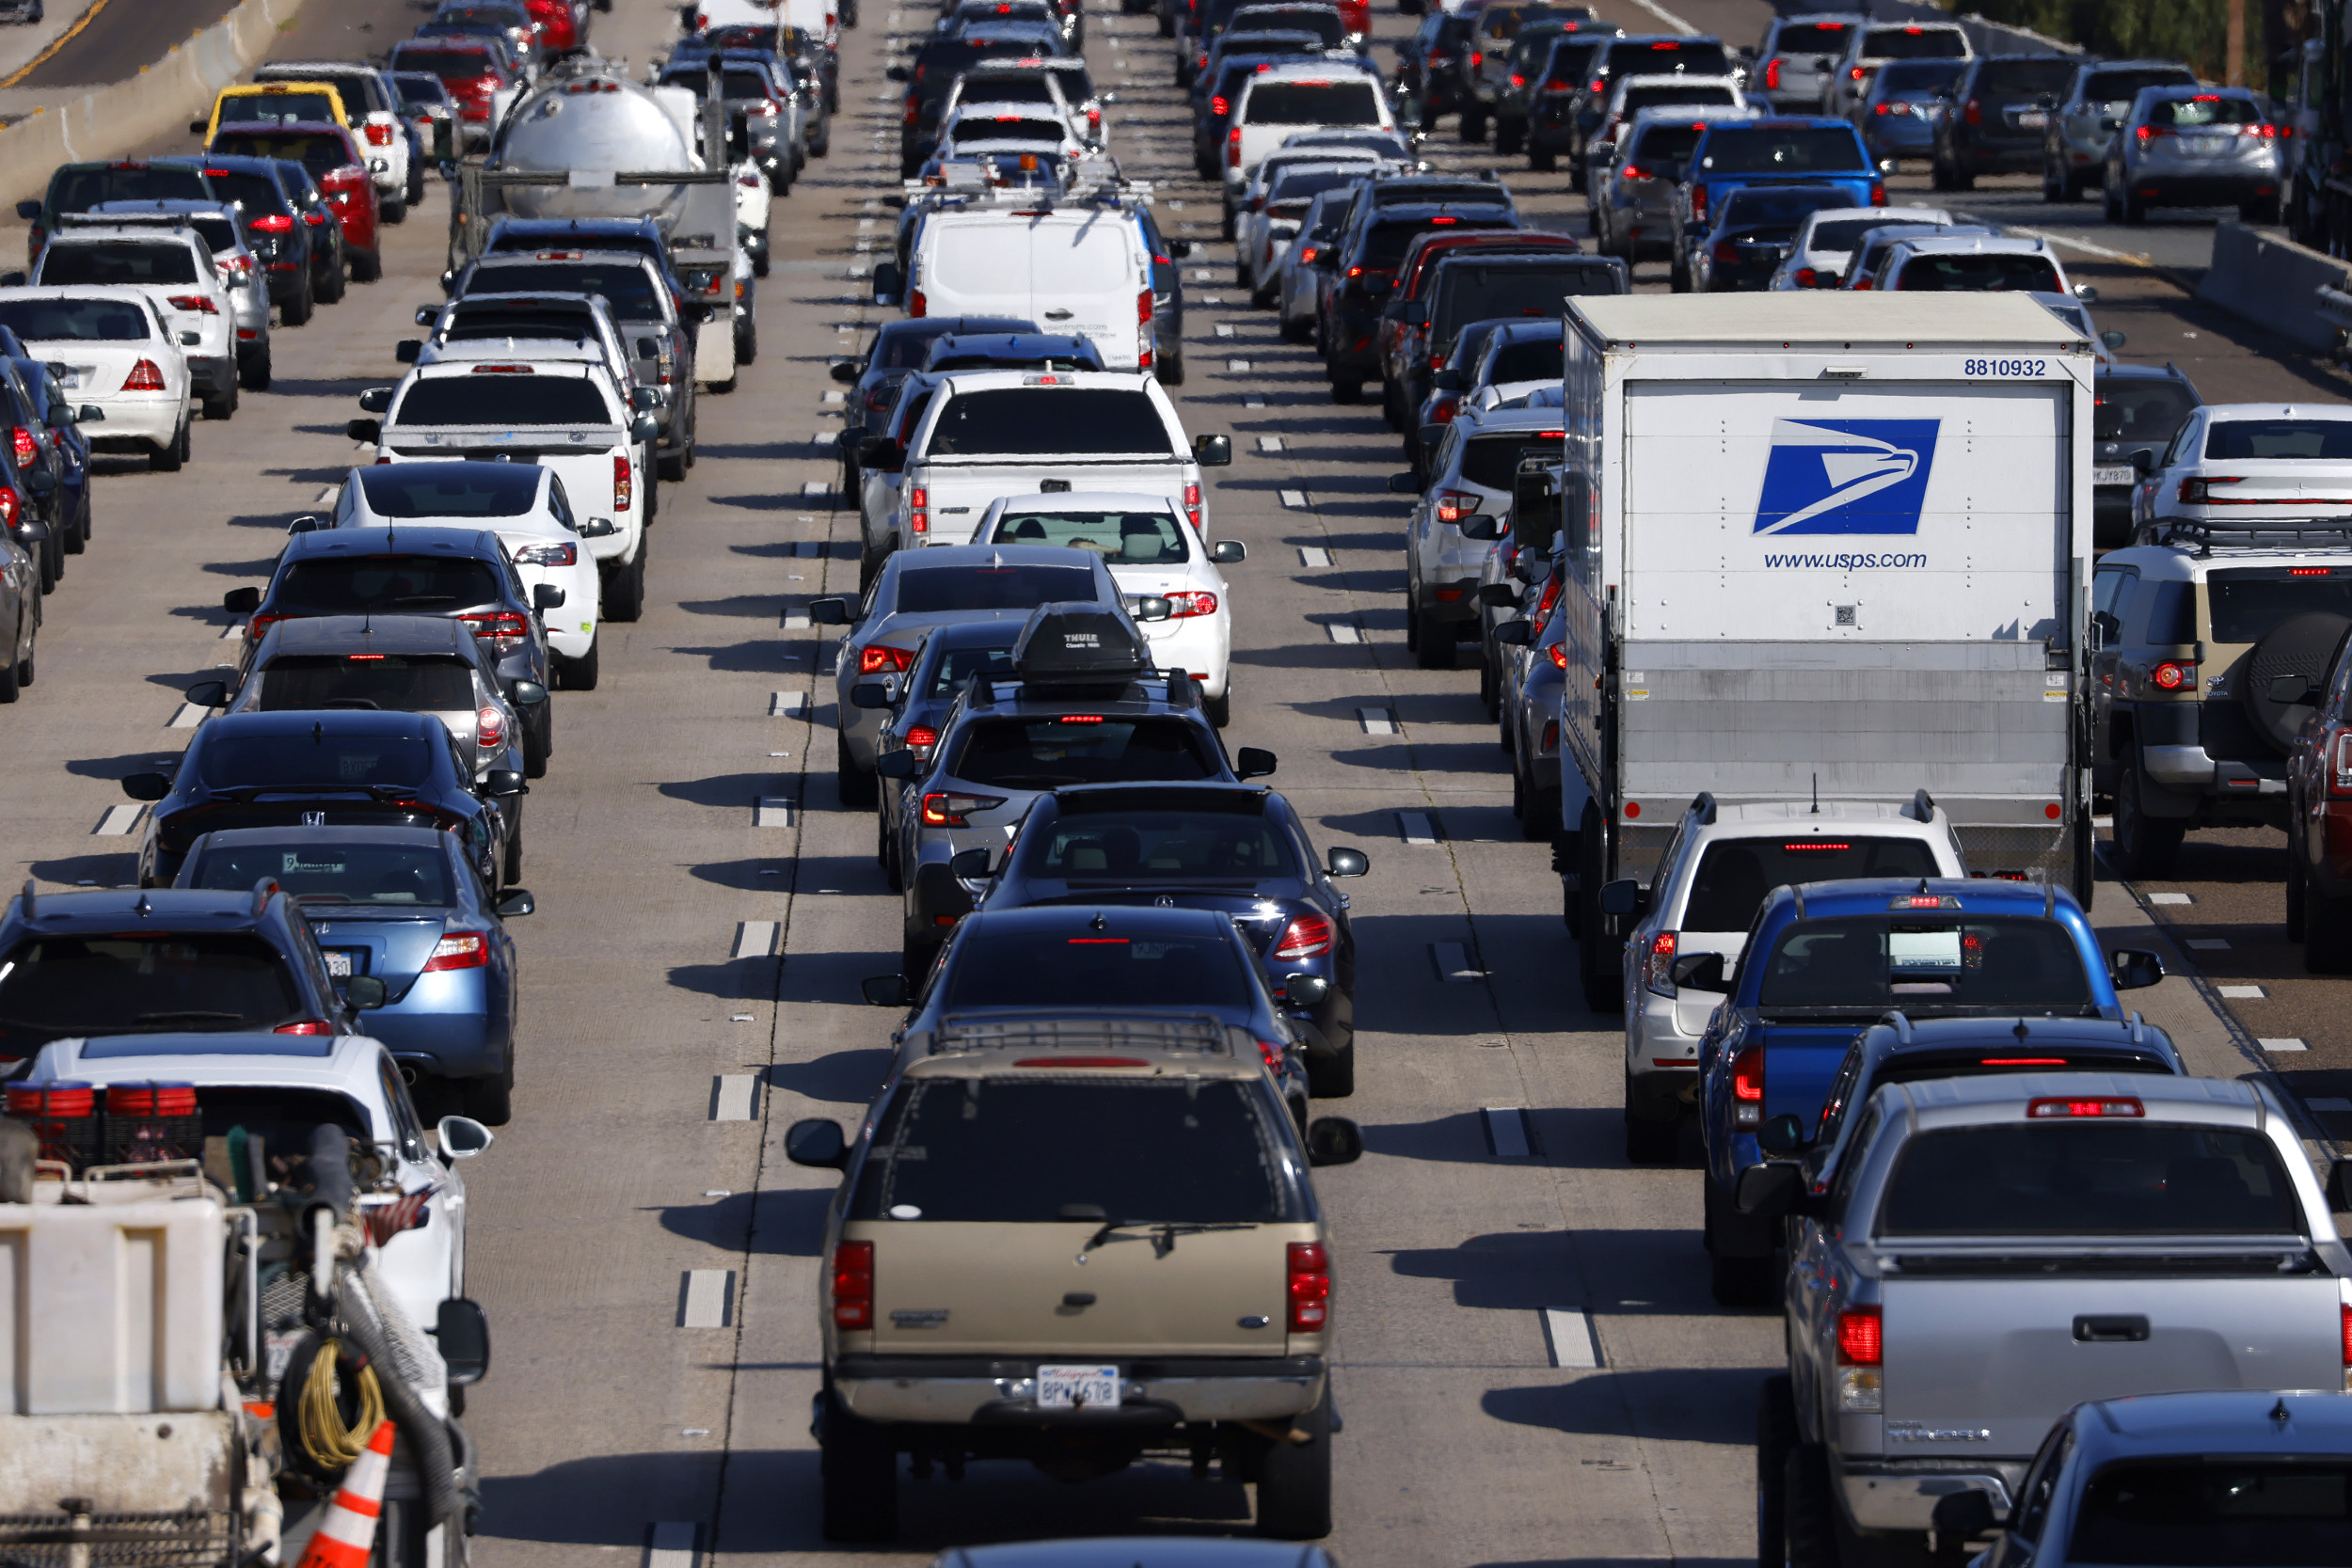
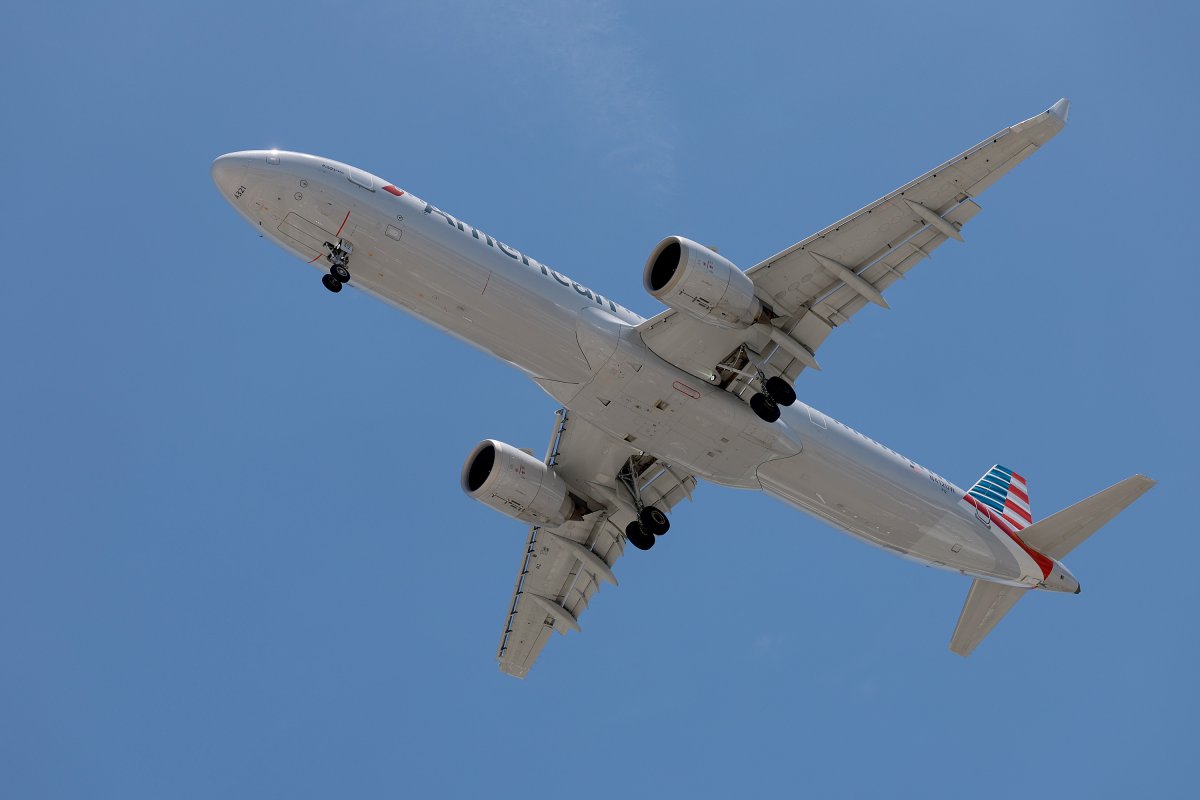
If you’re planning a trip over the upcoming holiday week, buckle up. It’s going to be crowded on the roads and in the skies this year.
Nearly 71 million Americans are expected to travel over the July 4 holiday period, marking a 5% increase in travelers from last year and an 8% increase over 2019, according to AAA.
“With summer vacations in full swing and the flexibility of remote work, more Americans are taking extended trips around Independence Day,” said Paula Twidale, senior vice president of AAA Travel. “We anticipate this July 4th week will be the busiest ever with an additional 5.7 million people traveling compared to 2019.”
AAA project 70.9 million travelers heading 50 miles or more from home over the Independence Day travel period, which covers all of next week as the holiday falls on a Thursday this year. With relatively low gas prices, a record-breaking 60.6 million people are expected travel by car, 2.8 million more than last year.
At the airports, a record-breaking 5.74 million people are forecast to take to the skies for their July 4 vacations this year.
The worst times to hit the road are between 2 p.m. and 7 p.m. next Wednesday and Sunday, according to INRIX, a provider of transportation data and insights.
“Drivers in large metro areas can expect the worst traffic delays on Wednesday, July 3rd, as they leave town, and Sunday, July 7th, as they return,” said Bob Pishue, transportation analyst at INRIX.
Pishue said car trips can take up to 67% longer than typical times during a busy holiday weekend, and recommends drivers start out in the morning.
| Date | Worst Travel Time | Best Travel Time |
| Monday, July 1 | Minimal Traffic Impact Expected | |
| Tuesday, July 2 | 2:00 – 6:00 p.m. | After 7:00 p.m. |
| Wednesday, July 3 | 2:00 – 7:00 p.m. | Before Noon |
| Thursday, July 4 | 2:00 – 7:00 p.m. | Before Noon |
| Friday, July 5 | 11:00 a.m. – 4:00 p.m. | Before 10:00 a.m. |
| Saturday, July 6 | 10:30 a.m. – 2:30 p.m. | Before 10:00 a.m. |
| Sunday, July 7 | 2:00 – 8:00 p.m. | Before 11:00 a.m. |
| Monday, July 8 | 1:00 – 5:00 p.m. | After 7:00 p.m. |
If you can’t leave first thing, experts say it’s often better to wait until after the evening rush if your plans allow for it.
| Metro Area | Route | Peak Congestion Period | Estimated Travel Time |
| Atlanta | Birmingham to Atlanta | Sunday, July 7 at 6:30 p.m. | 3 hours, 36 minutes |
| Boston | Boston to Hyannis | Thursday, July 4 at 1:45 p.m. | 1 hour, 51 minutes |
| Chicago | Chicago to Indianapolis | Wednesday, July 3 at 2:45 p.m. | 4 hours, 59 minutes |
| Denver | Fort Collins to Denver | Monday, July 8 at 7:30 a.m. | 1 hour, 37 minutes |
| Detroit | Toronto to Detroit | Monday, July 8 at 3:30 p.m. | 5 hours, 35 minutes |
| Houston | San Antonio to Houston | Saturday, July 6 at 1:30 p.m. | 3 hours, 48 minutes |
| Los Angeles | Bakersfield to Los Angeles | Monday, July 8 at 2:15 p.m. | 1 hour, 47 minutes |
| Minneapolis | Eau Claire to Minneapolis | Monday, July 8 at 4:45 p.m. | 1 hour, 43 minutes |
| New York | Jersey Shore to New York | Sunday, July 7 at 2:15 p.m. | 1 hour, 25 minutes |
| Philadelphia | Poconos to Philadelphia | Monday, July 8 at 8:30 a.m. | 3 hours, 17 minutes |
| Portland | Portland to Eugene | Wednesday, July 3 at 5:00 p.m. | 2 hours, 20 minutes |
| San Diego | San Diego to Palm Springs | Thursday, July 4 at 6:00 p.m. | 2 hours, 55 minutes |
| San Francisco | San Francisco to Monterey | Tuesday, July 2 at 5:45 p.m. | 2 hours, 31 minutes |
| Seattle | Ellensburg to Seattle | Sunday, July 7 at 4:30 p.m. | 2 hours, 19 minutes |
| Tampa | Tampa to Orlando | Wednesday, July 3 at 10:15 a.m. | 1 hour, 54 minutes |
| Washington, D.C. | Baltimore to Washington, D.C. | Monday, July 8 at 3:15 p.m. | 1 hour, 1 minute |
Independence Day also tends to be among the most dangerous holidays for driving in the U.S., following just behind New Year’s Day.
“Holidays also often go hand in hand with breaks from school or work, which can mean more teenagers or young adults on the roads who may have less driving experience, leading to risky driving and accidents,” a spokesperson from California-based injury law firm Omega Law told Newsweek.

Omega Law analyzed data from the National Highway Traffic Safety Administration’s fatality analysis reporting system from 2017 to 2021, finding South Dakota to be the most dangerous state for drivers during July 4th travel. Fatal car crashes in the state increased by 244% compared to any other day. Washington, D.C. was second, with a 182% increase in fatal crashes.
“Driving during a national holiday is always a risk,” according to the law firm. “Increased road traffic as people travel to attend events visit friends and family, or vacation can lead to congestion, delays, and a higher likelihood of accidents.”
| State | Average Fatalities | Average Accidents | Difference of Holiday Fatalities Compared to Average Day of July |
| South Dakota | 1.6 | 0.6 | 244% |
| D.C. | 0.2 | 0.2 | 182% |
| Vermont | 0.6 | 0.4 | 145% |
| New Hampshire | 1 | 0.8 | 118% |
| Connecticut | 1.8 | 1.6 | 99% |
| Michigan | 6.4 | 6 | 84% |
| Missouri | 5.4 | 4.4 | 82% |
| Minnesota | 2.4 | 2.2 | 77% |
| Delaware | 0.8 | 0.8 | 77% |
| Nevada | 1.4 | 1 | 68% |
| Idaho | 1.4 | 1.4 | 62% |
| South Carolina | 4.4 | 4.2 | 56% |
| Georgia | 6.8 | 6.8 | 51% |
| Pennsylvania | 5.4 | 5 | 47% |
| Florida | 11.2 | 9.4 | 44% |
| Washington | 3 | 2.8 | 42% |
| Oklahoma | 3.2 | 3 | 41% |
| Wisconsin | 3 | 2.8 | 40% |
| Oregon | 2.4 | 2.4 | 39% |
| Montana | 1.2 | 1 | 36% |
“It is essential for drivers thinking of traveling during a holiday to avoid peak travel times if possible and never drive while impaired.”
Hertz, the biggest car-rental company in the U.S., said Dallas, Denver, Salt Lake City, Los Angeles and San Francisco are the cities with the highest rental demand during the holiday week this year. The busiest pick-up days are projected to be this Friday and Saturday and next Wednesday.
The good news for drivers: gas prices are lower nationally than last year. As of Monday, the national average for a gallon of regular is $3.448. This time last year, it was $3.578, according to AAA’s gas price tracker.
AAA predicts pump prices will likely continue to trend downward leading up to July 4, assuming no major hurricanes develop that could negatively impact Gulf Coast oil production and refineries.
The 5.74 million people expected to fly this July 4 holiday week is an increase of nearly 7% compared to last year and 12% higher than 2019.
AAA booking data shows domestic airfare is 2% cheaper this Independence Day week compared to last year, making the average price for a domestic roundtrip ticket about $800.

Given those crowds, AAA recommends arriving at airports at least two hours early — even for domestic trips — reserving parking ahead of time and traveling with carry-on luggage to save time and money.
More than 4.6 million people are expected to travel by other modes of transportation including buses, cruises and trains.
That would be an increase of 9% compared to last year and just shy of 2019’s 4.8 million.
AAA noted that Alaskan cruises are particularly “in high demand,” which is consistent with Seattle and Anchorage being among the top domestic travel destinations.
The Top 10 domestic travel destinations are, per AAA:
The Top 10 international travel destinations are:
Newsweek is committed to challenging conventional wisdom and finding connections in the search for common ground.
Newsweek is committed to challenging conventional wisdom and finding connections in the search for common ground.