Jobs
Jobs Growth Points To Slowdown, But No Rate Cut

matdesign24/iStock via Getty Images
NEW YORK (July 5) – The Bureau of Labor Statistics (BLS) announced 206,000 new jobs, according to the Establishment Survey, a collection of job creation data from businesses. The number is above the 190,000 consensus estimates. However, April and May jobs creation figures were revised down by 57,000 and 54,000 new jobs, respectively, bringing the average jobs creation figure for the last three months to a moderate 177,300 new jobs, including an average of 35,000 government jobs. So, average private sector jobs creation in the second quarter is around 142,000 jobs. That’s a decent number, but for comparison, we added 277,000 workers to the workforce in June.
The BLS’s Household Survey, which polls the number of people taking jobs, and is viewed as eliminating workers taking more than one job, was roughly on par with the Establishment Survey at 190,000 new jobs.
The unemployment rate printed up, again, at 4.1 percent, the highest since December 2021. The “U6,” which is the percentage of the population that is unemployed, plus all persons marginally attached to the labor force, plus total employed part-time for economic reasons, plus all persons marginally attached to the labor force, printed at 7.4, creating a three-month trend and up 50 bps since this time last year.
Analysis and Opinion
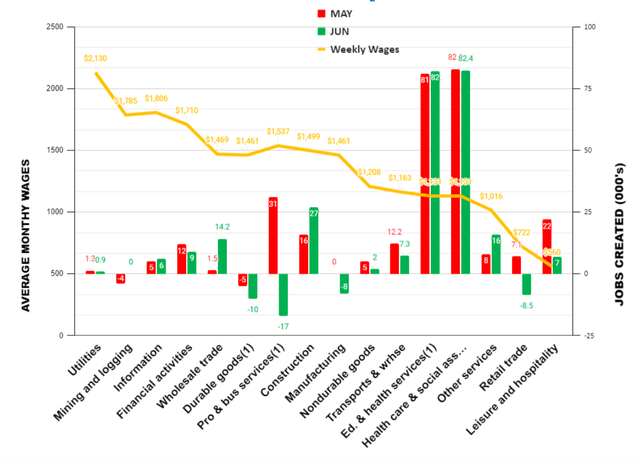
Let’s look at our exclusive schedule of May and June Jobs by Average Weekly Wages:
May & June Jobs Creation by Average Weekly Wages (1.) Includes other industries, not shown separately. (© 2024 The Stuyvesant Square Consultancy )
Jobs creation in June was, again, led by those positions that tend to have government support, like Private Education & Health Services, which added 82,000 new jobs, net, including 82,400 Healthcare and Social Services jobs. (We do not include “official” government employee jobs payrolls in our chart. Such government payrolls, 70,000 jobs, are included in the 206,000 jobs reported today by the BLS.)
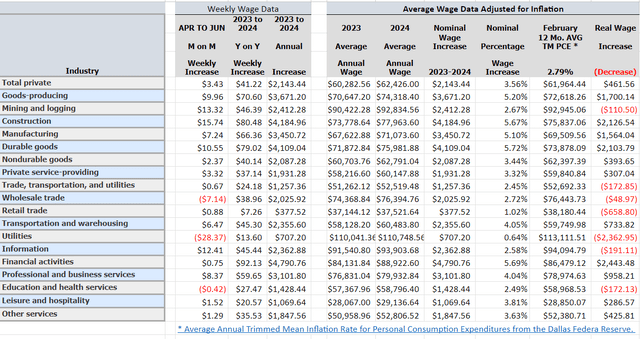
Higher paying jobs creation was, again, virtually moribund, save for Construction. Lower wage jobs, such as Other Services, together with the aforementioned, Education, Health, and Social Services were the majority of the new jobs creation in the Establishment Survey. Our Quarterly Analysis of Real Weekly Wages printed as follows:
Quarterly Summary of Real Weekly Wages (© 2024 The Stuyvesant Square Consultancy)
Throwing Shade on the Government’s Numbers
The seeming slowdown in what has purportedly been robust job growth in the first six months of this year was presaged by stories last month that have thrown shade on the BLS jobs data from 2023.
First, Bloomberg reported that data published by the BLS infers an overstatement of an average 60,000 jobs throughout 2023, beyond some of the extremely high jobs revisions that came in with the monthly jobs revisions. That would mean that the 2.7 million new jobs originally reported for 2023 was actually just 2 million jobs. Second, Axios reported that, according to an analysis by Standard Chartered Bank,
“(a)bout half of the non-farm payroll job growth since October 2023 has come from asylum-seekers, refugees and other migrants who have been authorized to work in the U.S.”
The Standard Chartered Bank analysis, which is only available to its clients, was summarized by investor blog Zero Hedge as saying,
“The ability to track EAD (Employment Authorization Documents – ed.) issuance to undocumented workers is an advantage in estimating how much they have contributed to employment growth. NFP (Non-farm payrolls – ed) counts workers with an EAD just like any other. Using that data, it is easy to estimate that undocumented workers have added 109k jobs per month to NFP out of the average 231k increase so far in FY24.
Economy Generally
GDP growth printed at 1.4 percent in the Second Quarter, according to the third and final estimate.
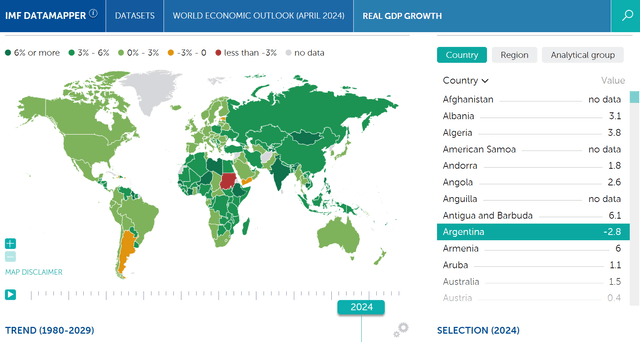
US growth is arguably just “the tallest pygmy”, among the Group of Seven. Compared with other economies, and particularly some developing economies. See the chart from the International Monetary Fund, below and its interactive counterpart, linked here.
Global Estimates of GDP Growth (International Monetary Fund)
Particularly troubling, though, is that so much of the US GDP growth, as well as job growth, is fueled, directly and indirectly, by enormous government spending, including the Ukraine War funding, and is funded largely by government debt.
This other interactive chart, from the IMF, shows how excessive our debt to GDP ratio, at over 123 percent, is relative to other G7 economies. Only Japan and Italy are worse off.
Much of the purported US “growth” is from the government; around 40% of our total GDP, among federal, (23%) state, and local (15%, together) government expenditures.
Federal Reserve Policy
The Federal Reserve’s latest Summary of Economic Projections (informally, its “dot plots”) show a central tendency of 1.8 to 2.3 percent growth for the years, including 2024, through 2026, down somewhat from the March projections.
This sentence, from the Fed minutes, was disconcerting:
“A few participants pointed to downside risks to economic activity associated with the fragility of some parts of the CRE (Commercial Real Estate – Ed.) sector or the vulnerable balance sheet positions of some banks.”
But the Fed nevertheless seemed more hopeful in achieving its dual mandate of stable prices and full employment in its June meeting than in its April-May meeting. We’re less sanguine.
We have said for quite some time that the Federal Reserve balance sheet is too large; much larger than it should be, given how far we are from the pandemic. As of June 24th, the Fed balance sheet was still at $7.2 trillion; roughly where it was in December 2020. Before the pandemic, the Fed’s balance sheet was just $4.1 trillion.
We believe the Fed is loosening its rate of quantitative tightening because of the enormous risk to regional banks. Commercial real estate loans originated during the ZIRP or near-ZIRP rates that prevailed in the aftermath of the 2008 financial crisis are coming to maturity and require refinancing. Many of those loans will have to be refinanced at rates that are three or four hundred basis points higher than they were when the loan originated. Those financing costs, together with the enormous cost increases in commercial real estate insurance and other costs that have evolved since the pandemic, will hinder cash flows and cause many owners of commercial real estate to simply default and “hand over the keys” to the lender. The Fed minutes from the last meeting mentioned valuations of commercial real estate, or CRE, being overstated. We think that’s true and will likely affect some of the regional banks.
We continue to believe, as we have said for months now, that monetary policy, and the Fed’s effort to assure a “soft landing” continues to be far too accommodating, and has been a longer-term mistake. Furthermore, we see it in the continuing Trimmed Mean Inflation rate, 2.79 percent. Continuing inflation bears out the obvious effect of the excess money supply and bloated Federal Reserve balance sheet.
Policy Making
Readers should regularly look at the schedules of “Household Debt and Credit“, prepared quarterly by the Federal Reserve Bank of New York, to monitor debt and delinquency figures, particularly among “Generation Z”; young people 18 to 29 who are the principal drivers of family formation that drives so much of GDP. Fiscal policy is adding another trillion dollars to the national debt every 100 days.
All that cash sloshing around – from fiscal and monetary policy – has, we think, artificially boosted asset prices, including home prices and securities values, above where they would otherwise be. We believe it sets up a reckoning in the future: either continued inflation (as the spending continues and deficits increase) or a sharp and perhaps lengthy recession; the kind of lengthy economic malaise we saw after the 2008 financial crisis.
Failing to arrest this fiscal and monetary policy – and soon – will, we believe, result in a Hobson’s Choice of policymaking, where future prosperity is at substantial risk.
Looming “Gray Swans”
There are at least four looming “Gray Swans” facing the economy.
“Gray swans,” as opposed to “Black Swans,” are events that can be foreseen, but are unlikely. Black Swans are totally unpredictable. (A Gray Swan is comparable to a hurricane in hurricane season, whereas a Black Swan would be something like a devastating earthquake.) Virtually all the looming Gray Swans we can foresee are attributable to bad national policy choices. They include:
De-dollarization. The choice to try to weaponize the dollar against Russia for its invasion of Ukraine has led several nations to do direct settlements in their own currencies. We discussed the prospect of this happening here in February 2022. It has now come to be with the passage of the “21st Century Peace Through Strength Act” (H.R.8038), which I discussed further here.
Oil Shock. The Biden Administration tapped America’s Strategic Petroleum Reserve to artificially lower oil and gasoline prices. At the time, the Washington Post said the results showed the “wind was at the back” of the GOP. The Biden White House did the same in October 2022, shortly before the midterm federal elections. Given flashpoints in Eastern Europe and the Western Pacific, a dearth of needed oil in the US SPR in the event of a kinetic conflict could strangle the economy with expensive fuel costs.
Municipal bankruptcy. The stress and costs of migrants could force a technical default on municipal general obligation bonds of some “sanctuary cities.”
Russian retaliation for US supplied missile strikes. As the war in Ukraine continues, there is an ongoing risk of escalation and perhaps Russian retaliation against US interests, including by cyber warfare and other asymmetrical attacks.
Troubled clearings of Treasury Auctions. With no discernible plans by the White House or Congress to address spending or taxes, it may occur that the bid/ask on U.S. Treasuries mismatch as demand fails to meet the supply, thereby causing a substantial rate increase. This happened in November 2023, when a lack of demand caused an auction of 10-Year Treasuries failed to clear, causing rates to increase.
GDP Prognostication
We expect GDP for the second quarter to print later this month (July 27th) at 1.25 percent, +/- 25 bps and the economy to slow and unemployment to rise. We think we’re on the cusp of a “stagflation” cycle, with tepid growth, higher unemployment, and continued inflation. Furthermore, we don’t believe the Fed will be comfortable reducing rates until at least 2025Q1, despite the slowing economy because inflation will remain above the target rate.
Sector Performance
LONG: Higher end retail and Hospitality; Defense; Oil & Gas
SHORT: Lower-end retail and Quick Serve Restaurant Chains, Transports,
June Other Data Points
The Institute for Supply Management’s Manufacturer’s Purchasing Managers Index (PMI) at 48.5 for June, shows the industrial economy contracting, faster after a brief period of expansion 3 months ago. (The months of contraction that had been interrupted by a brief March growth number of 50.3. A reading below 50 signals contraction.) Prices continued to increase, but more slowly, from 57.0 to 52.1. The May ISM Services Index, showed the service economy declining for the second time in three months, from 53.8 to 48.8.
The Job Openings and Labor Turnover Survey (JOLTS) for May, released Tuesday, printed slightly better again, with 221,000 more job openings in May than in April, but down 1.2 million from last year. There were 85,000 few job separations in May than in April, but there were 424,000 fewer separations than last year.
Privately‐owned housing units authorized by building permits in May slowed markedly, at a seasonally adjusted annual rate of 1,386,000. This is 3.8 percent below the revised April rate of 1,440,000 and is 9.5 percent below the May 2023 rate of 1,532,000.
Personal income and outlays, for May, released June 28, showed disposable personal income up 0.5 percent in current dollars and also up 0.5 percent in chained 2017 dollars. (“Chained dollars” is a measure of inflation that considers changes in consumer behavior in response to changes in prices.) Personal income in current dollars was also up 0.5 percent.
The February Personal Consumption Expenditures (PCE) Index from a year ago, excluding food and energy, released the same day, and reported to be the Federal Reserve’s preferred measure of inflation, printed at 2.6 percent, year-on-year, down from 2.8 percent last month. PCE inflation, also called “headline inflation,” also printed at an annualized 2.6 percent. Annualized inflation rates have barely budged for months, with the biggest move being only 30 bps.
The RCP/TIPP Economic Optimism Index (previously the IBD/TIPP Economic Optimism Index) for July, released Tuesday, increased from 36.8 in June to 40.7 in July, marking a 10.6% gain. The index has printed in negative territory for 34 consecutive months.
_____________________________________
NOTE: The views expressed, including the outcome of future events, are the opinions of this firm and its management only as of July 5, 2024, and will not be revised for events after this document was submitted to Seeking Alpha editors for publication. Statements herein do not represent, and should not be considered to be, investment advice. You should not use this article for that purpose. This article includes forward-looking statements as to future events that may or may not develop as the writer opines. Before making any investment decision, you should consult your own investment, business, legal, tax, and financial advisers. We associate with principals of Technometrica, co-publishers of the TIPP Economic Optimism Index, on survey work in some elements of our business. Our commentaries most often tend to be event-driven. They are mostly written from a public policy, economic, or political/geopolitical perspective. Some are written from a management consulting perspective for companies that we believe to be under-performing, and include strategies that we would recommend to the companies of our clients. Others discuss new management strategies we believe will fail. This approach lends special value to contrarian investors to uncover potential opportunities in companies that are otherwise in a downturn. (Opinions here regarding whether to buy, sell, or hold such companies, however, assume the company will not change its current practices).


:max_bytes(150000):strip_icc()/roundup-writereditor-loved-deals-tout-f5de51f85de145b2b1eb99cdb7b6cb84.jpg)


