Bussiness
Ethereum ETF approaches: Comparing ETH and BTC’s states pre-launch

- Ethereum ETFs were gaining much popularity in the United States.
- ETH was down by 12% last week, but a few market indicators hinted at a trend reversal.
Ethereum [ETH] has been facing multiple price corrections over the past month. This happened at a time when its much-awaited ETH ETFs launch was drawing in.
Therefore, let’s take a look at what’s going on with ETH to find out whether its launch would benefit the king of altcoins and allow it to outshine Bitcoin [BTC] in the coming days.
Ethereum ETF hype isn’t enough?
Investors and the crypto market as a whole have been waiting patiently for the launch of ETH ETFs. As per the latest data, the possible launch of Ethereum ETFs can be expected on the 15th of July.
AMBCrypto’s look at Google Trends’ data showed that the popularity of Ethereum ETFs has been consistent throughout the last 30 days in the United States, reflecting the hype around them.
Although the launch date was getting closer and the market seemed excited, Ethereum continued to struggle to raise its price.
According to CoinMarketCap, ETH was down by more than 125 in the last seven days. At the time of writing, the token was trading at $3,045.32 with a market capitalization of over $366 million.
A possible reason behind this bearish price movement could be the lack of confidence in ETH among investors.
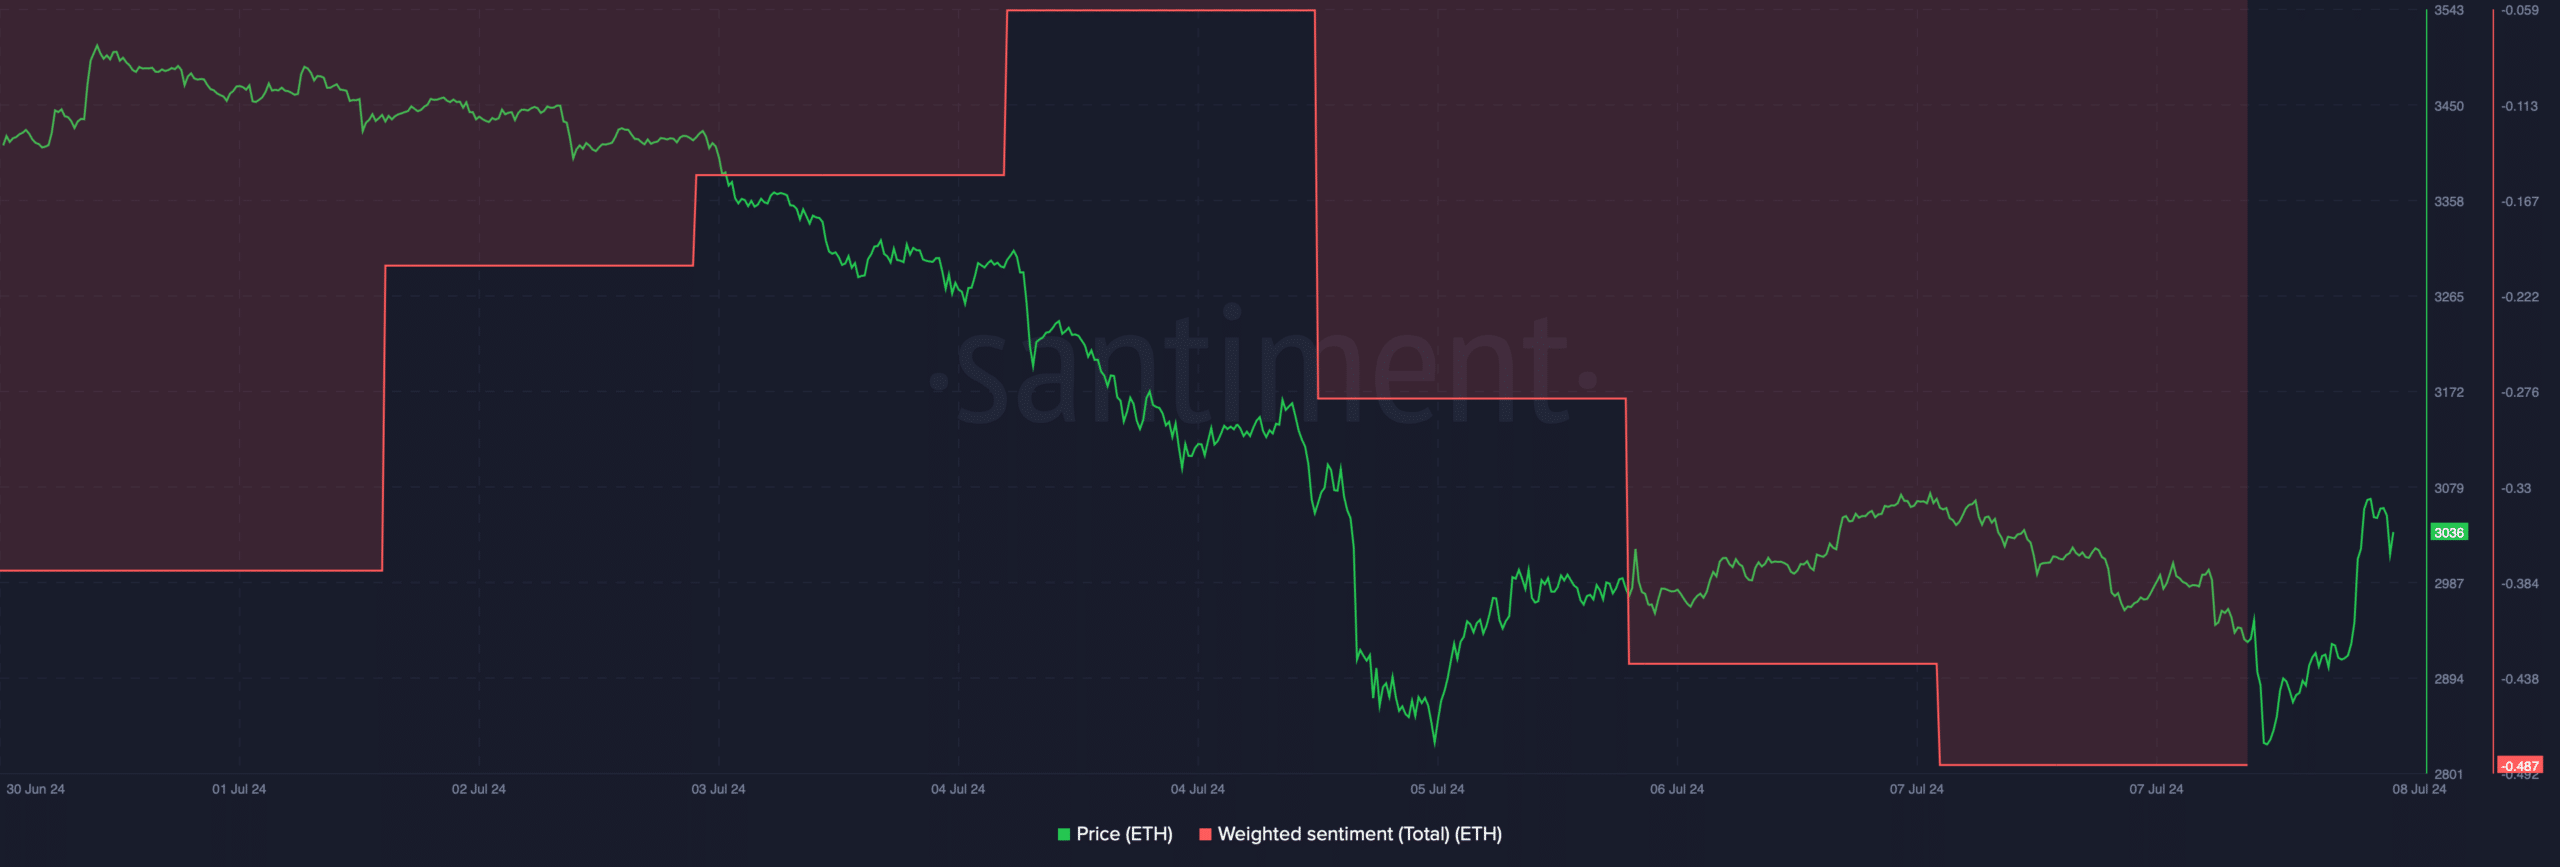
AMBCrypto’s analysis of Santiment’s data revealed that ETH’s Weighted Sentiment moved southward substantially last week. This clearly meant that bearish sentiment around the token was dominant.
Bitcoin vs. Ethereum ETF
Since ETH remained bearish despite the launch getting closer, AMBCrypto planned to compare both Ethereum and Bitcoin’s states ahead of their ETF launches.
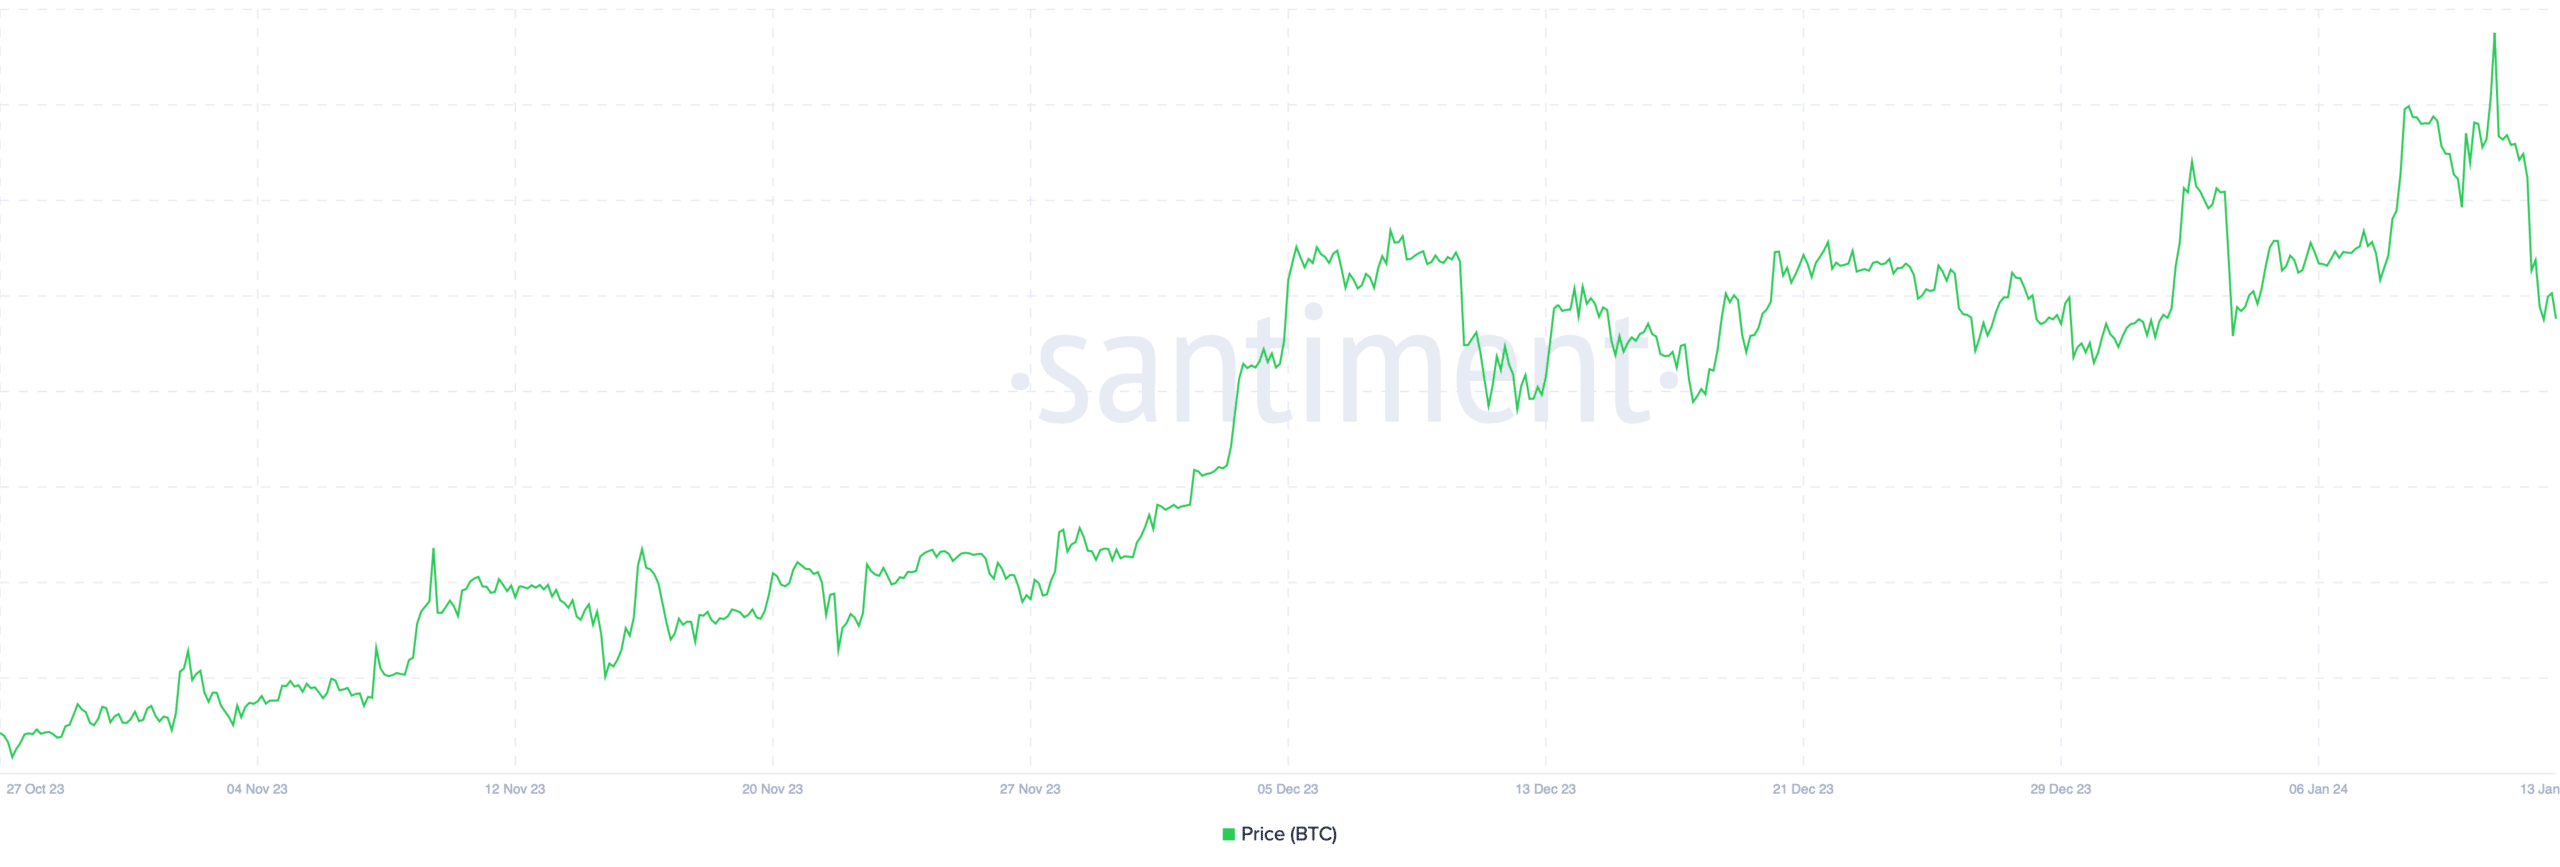
Our analysis revealed that BTC’s price started to gain bullish momentum way before its ETF launch date.
To be precise, BTC’s price started to move in November 2023 and peaked during the BTC ETF launch on January 10, 2024. However, soon after the launch, BTC’s price started to decline.
On this front, Bitcoin was clearly dominating Ethereum. However, to see whether ETH was planning something bullish a week ahead of the ETF launch, we then analyzed ETH’s daily chart.
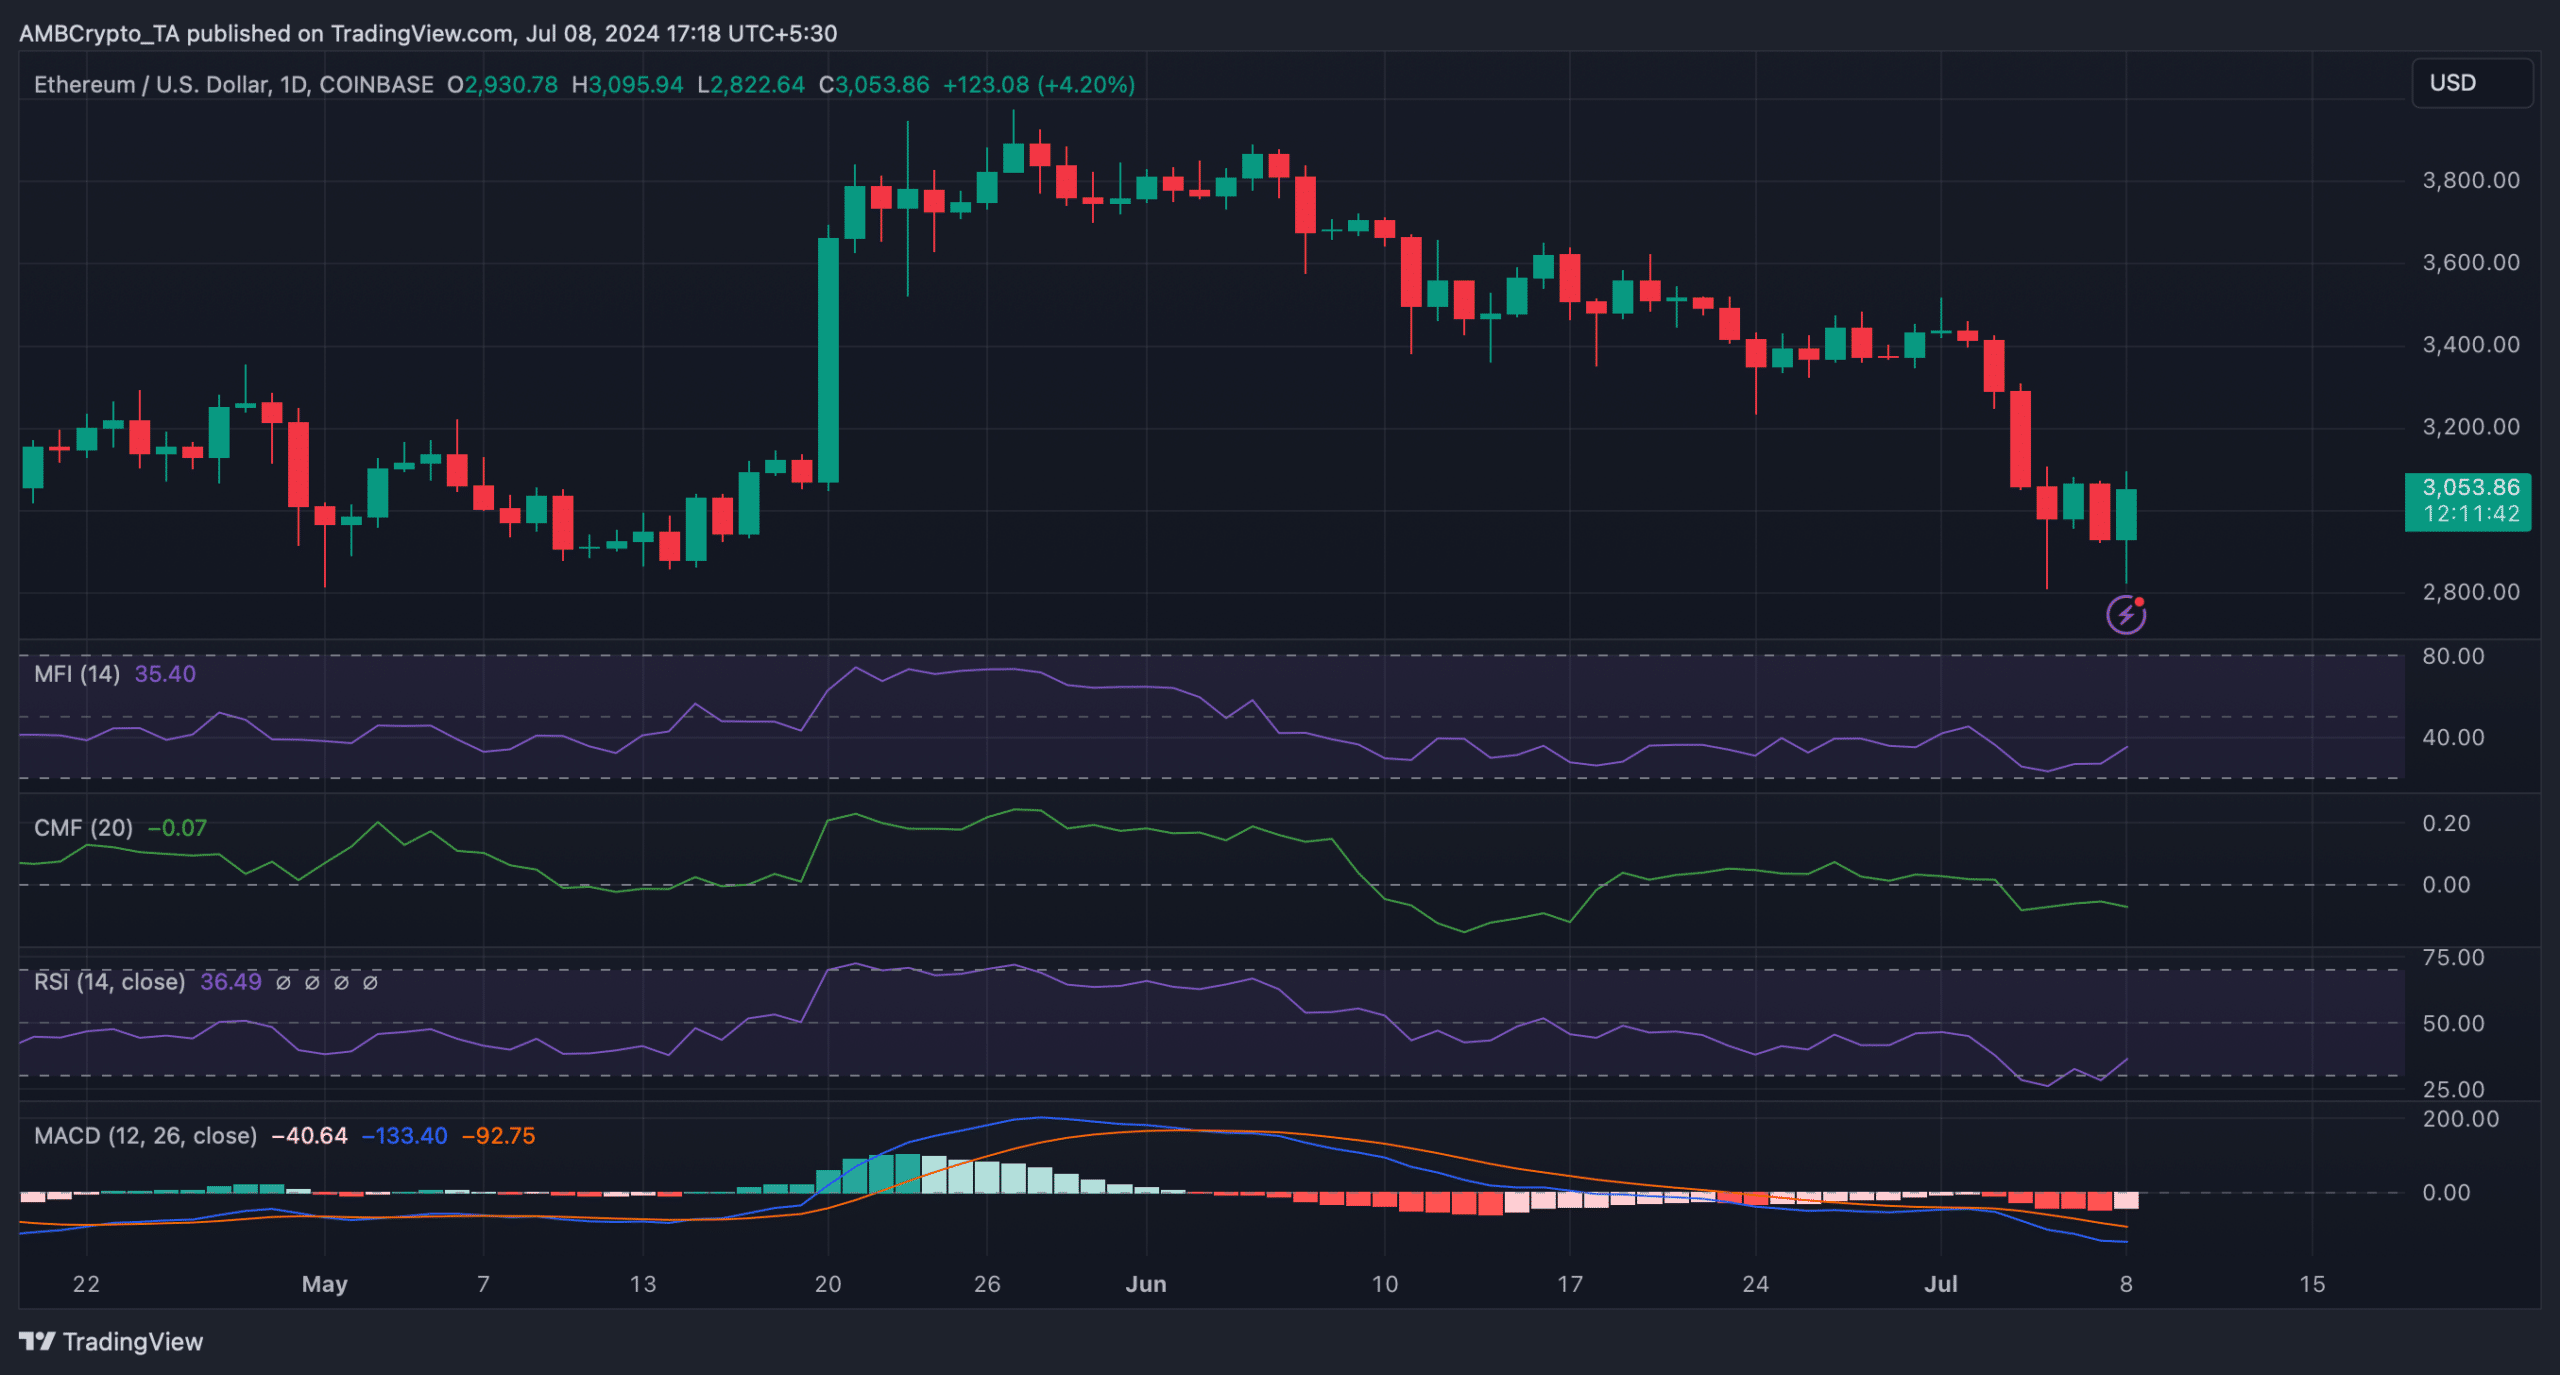
We found that Ethereum’s Relative Strength Index (RSI) registered an uptick after touching the oversold zone.
Read Ethereum’s [ETH] Price Prediction 2024-2025
Additionally, the Money Flow Index (MFI) also followed a similar increasing trend. This indicated that ETH might turn bullish in the coming days.
Nonetheless, the Chaikin Money Flow (CMF) moved southward. The MACD also displayed a bearish advantage in the market.


:max_bytes(150000):strip_icc()/roundup-writereditor-loved-deals-tout-f5de51f85de145b2b1eb99cdb7b6cb84.jpg)


