Infra
BUI: Quality Utility And Infrastructure Fund With 6.5% Income

Khanchit Khirisutchalual
Introduction:
BlackRock Utilities, Infrastructure & Power Opportunities Trust (NYSE:BUI) is a closed-end fund that was incepted over 12 years ago in Nov. 2011. The fund seeks to invest in Utilities and Infrastructure companies that are engaged in power generation or distribution.
The investment mandate for the fund is broad. It can invest in any company that is engaged in the development or operation of generation or distribution of electricity, water, or other natural resources, including telecommunications, renewable energy, or sources of renewable energy. The fund is global in nature and can invest significant portions of its assets in companies that operate outside the United States. The fund also sells (writes) call options on a portion of the underlying equity portfolio, potentially reducing the fund’s volatility and generating additional income.
As per the fund’s literature,
“BlackRock Utilities, Infrastructure & Power Opportunities Trust’s (BUI) (the ‘Trust’) investment objective is to provide total return through a combination of current income, current gains and long-term capital appreciation. The Trust seeks to achieve its investment objective by investing primarily in equity securities issued by companies that are engaged in the Utilities, Infrastructure, and Power Opportunities business segments anywhere in the world and by utilizing an option writing (selling) strategy in an effort to enhance current gains. The Trust considers the ‘Utilities’ business segment to include products, technologies, and services connected to the management, ownership, operation, construction, development, or financing of facilities used to generate, transmit or distribute electricity, water, natural resources or telecommunications and the ‘Infrastructure’ business segment to include companies that own or operate infrastructure assets or that are involved in the development, construction, distribution or financing of infrastructure assets. The Trust considers the “Power Opportunities” business segment to include companies with a significant involvement in, supporting, or necessary to renewable energy technology and development, alternative fuels, energy efficiency, automotive and sustainable mobility, and technologies that enable or support the growth and adoption of new power and energy sources. Such companies may include, among others, electrical equipment producers (such as wind turbine manufacturers), producers of industrial and specialty chemicals (such as building insulation producers), and semiconductor and equipment companies (such as solar panel manufacturers). Under normal circumstances, the Trust invests a substantial amount of its total assets in foreign issuers, issuers that primarily trade in a market located outside the United States or issuers that do a substantial amount of business outside the United States. The Trust may invest directly in such securities or synthetically through the use of derivatives.“
Other salient features of this fund are as follows:
- The fund is focused on providing total returns to its shareholders that include regular and mid-to-high monthly distributions.
- The fund uses zero leverage, which is definitely an advantage during a high-interest rate regime.
- The fund has a decent record of performance when we look at the long term. However, the more recent performance is downright negative, in line with the other similar funds in the same sector. Since its inception over 12 years ago until Mar. 31, 2024, it has returned 8.65% annually on a NAV (net asset values) basis, despite challenges and nearly flat returns in the past three years. Furthermore, the fund has returned 7.50%, 8.57%, 3.41%, and 3.69% for the 10, 5, 3, and 1-year periods, respectively, on the NAV basis. These results assume that all distributions were reinvested.
- The fund follows a “managed” distribution policy and pays a consistent amount monthly, which currently yields 6.50%. It has paid the same amount of $0.1210 per share every month since 2014.
- As per its mandate, the fund can invest globally, and it has a substantial portion (nearly 40%) of its assets in companies that are located outside the U.S. However, most of its foreign investments are located in continental Europe. It is also invested in Canada to the extent of roughly 5% in Canada. Other countries, such as in Asia or South America, make up less than 5% allocation.
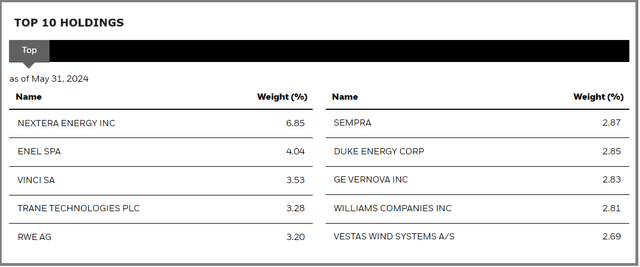
- BUI is a sector-specific fund, so by nature, it is concentrated in certain types of companies. As such, as of Dec. 31, 2023, it was invested in 56 equity positions that it calls long-term investments. Besides, it had 110 positions in derivative instruments, mostly in the form of call-options. As of May 31, 2024, its top 10 holdings represented nearly 35% of the total assets.
- As of Jul. 09, 2024, the fund under its management had roughly $508 million in net assets (as well as total assets).
- The fund is an actively managed fund and has an expense ratio of 1.08% (including 1% of the management fee) based on the total (and net) assets.
- As of Jul. 09, 2024, its distribution yield on the market price was 6.50% and 6.40% on the NAV.
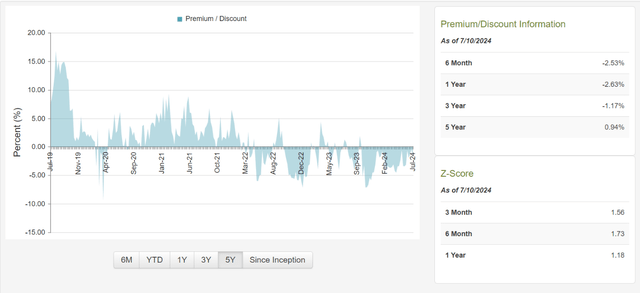
- As of Jul. 09, 2024, BUI’s market price offered a discount of -1.15% to its NAV. However, on a 3-year average basis, it has traded at a very similar discount of -1.17% and at a small premium of 0.94% on a 5-year average basis.
Financial Outlook:
Let’s look at the Fund’s Financial health and performance. The most recent detailed report that is available to investors is the annual report for the period of Jan. 2023 – Dec. 31, 2023. However, the semi-annual report should be due any time now.
Net Investment Income:
The net investment income (or NII in short) is the net income that a fund earns. This comes from its investment in the form of dividends, distributions, and interests or derivatives like options, minus all the fund’s expenses, including management fees, operating expenses, commissions, and interest on leverage. For equity-based funds, especially in high-growth sectors like technology, the NII is not very relevant. However, for fixed-income or bond funds, it is very relevant.
Here is what it looks like in terms of NII, Distributions, and Net Assets at the beginning and end of the statement period.
(All amounts are in US $ (except Shares Outstanding) for the 12-month period; negative amounts are shown inside parentheses, per the annual report, 12 months ending Dec.31, 2023. We also provide the data for the year 2022 for comparison.
Table-1:
Data source: BUI’s 2023 annual report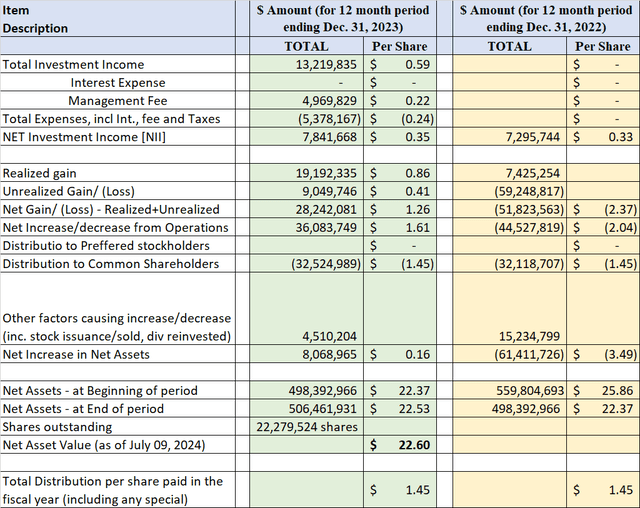
Distributions:
BUI has provided the same amount of monthly distributions since 2015. Its yield is a bit low compared to other closed-end funds in the Utility sector, such as DNP Select Income (DNP) and Reaves Utility Income (UTG). However, we should keep in mind that BUI uses no leverage, while both UTG and DNP use modest levels of leverage, 20% and 28%, respectively. So, in a way, a 6.5% yield is very manageable and good for the long-term health of the fund’s NAV (net asset value). At the same time, it is high enough to appeal to many income investors.
So, is the distribution covered?
BUI is an equity fund, so there is simply not enough NII (Net Investment Income). It has to meet the major part of distributions from realized capital gains.
Table-2: Distribution Data
|
YEAR |
Net Inv Income |
ST Capital Gains |
LT Capital Gains |
ROC (Return of Capital) |
|
2023 |
25.18% |
34.53% |
6.22% |
34.07% |
|
2022 |
22.42% |
29.69% |
11.25% |
36.63% |
Note: The distribution data for the year 2022 is taken from CEFConnect, as we could not get the information from BUI’s website.
We can observe from the above table that distribution sources can vary from year to year. We see that both in 2022 and 2023, it paid nearly 1/3rd of the distributions from ROC (return of capital). The Utility sector has performed quite poorly since 2022, so we have to see things from the long-term perspective. The sector is showing signs of recovery right now. Furthermore, the AI factor is playing a role in the recovery of the utility sector due to the expectations of increased power demand in the future. What we need to know is if the fund can maintain or grow its NAV over time. Currently, the NAV is roughly 20% above the inception NAV, so it may be fair to conclude that distributions have not been destructive to NAV.
Discount/Premium:
The fund is currently trading at a minimal discount of -1.15% to its NAV. This is very similar to its 3-year history. On a five-year basis, it has traded at a small premium of under 1%.
Below, a five-year chart is presented, showing the discount and premium information. We can see that If we look at the 5-year chart below, until early 2022, it was mostly trading at a premium. However, since then, it has mostly traded discounted. This period (of discount) represents mostly the time of high interest rates. All that said, we should always look at both the premium/discount and the overall valuation of the fund within its sector. Currently, generally, stocks, especially technology stocks, are expensive, but that is not exactly true with the utility sector.
Chart-1: BUI – Premium/Discount Chart
Funds Holdings:
The fund is sector-specific but fairly diversified within the sector. It is spread across many segments of the Utility and Infrastructure sector. As of Dec. 31, 2023, it had 56 long-term equity positions. However, it also had 110 positions open in the form of call options. As of May 31, 2024, it has overwritten nearly 34% of the portfolio value via call options on individual equity positions.
The top 10 holdings, which are mostly equity positions, make up roughly 35% of the total assets. Some top holdings are NextEra (NEE), Enel SPA (OTCPK:ENLAY), Vinci SA (OTCPK:VCISF), Trane Technologies Plc (TT), RWE AG (OTCPK:RWEOY), Sempra (SRE), Duke Energy (DUK), GE Vernova (GEV), Williams Cos (WMB), and Vestas Wind (OTCPK:VWDRY).
The top holdings and asset composition as of May 31, 2024, are presented below.
Table-3: Holdings as of 05/31/2024
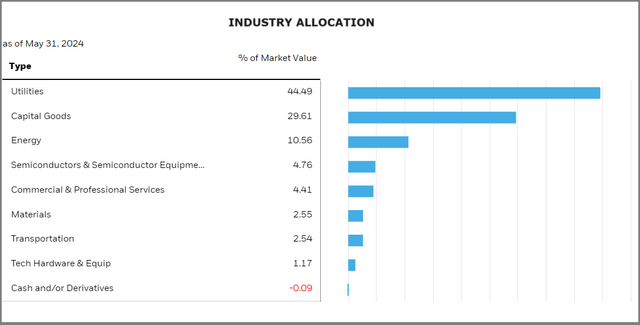
Chart-2: Industry Segment Allocation (as of May 31, 2024)
Table-3B: Geographic Allocation
Fund’s Literature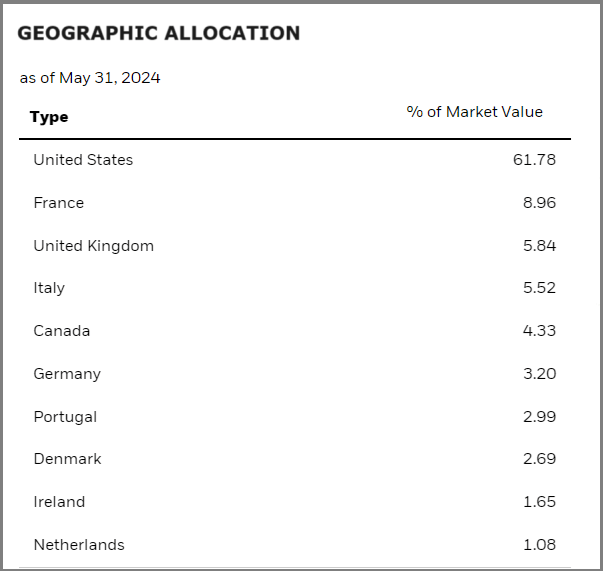
Performance and Valuation:
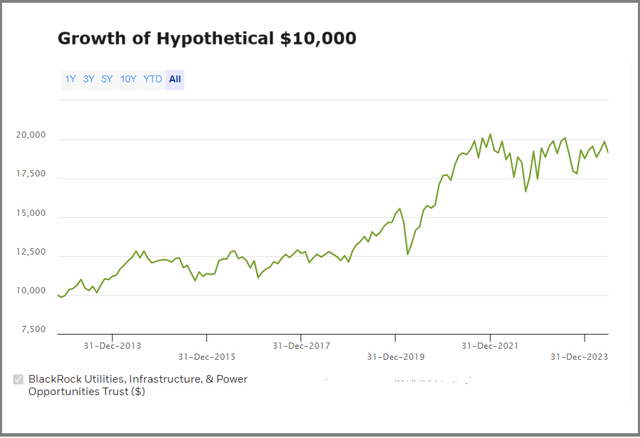
The long-term performance, especially since inception, has been decent, keeping in mind that this is a Utility-focused fund with zero leverage. Furthermore, since 2021, the utility funds have performed quite poorly due to the high interest rates, which has taken off at least a couple of percentage points of annual returns from its long-term returns. The yield is not exceptionally high for a CEF but decent enough at 6.5%. This mid-range level of distributions has been helpful to the fund through thick and thin, and it has been able to increase its NAV significantly over the years. However, the fund offers almost no discount (close to -1%); even then, the z-scores indicate that discounts are better compared to historical averages. At the same time, the fund has recovered quite a bit in the last year and a half, and it is no longer cheap.
Chart-3: Growth of $10,000 since inception
Table-4: Annual Returns over 1,3, 5, and 10 years and also since inception (As of Mar. 31, 2024)
Let’s see how the fund compares over the last 3, 5, and 10 years (and since inception) with the S&P 500 and a host of other Utility and infrastructure funds. These funds differ in many ways from each other, even though they may be similar in terms of the type of their underlying investments.
- BUI
- DNP Select Income
- Reaves Utility Income
- The Utilities Select Sector SPDR ETF (XLU)
- SPDR S&P 500 ETF Trust (SPY).
Table-5: (Data – period as specified, if not specified then as of May 31, 2024)
|
Item Desc. |
BUI |
DNP |
UTG |
XLU |
S&P 500 |
|
Dividend Yield% (as of 07/09/2024) |
6.50% |
9.34% |
8.19% |
3.16% |
1.22% |
|
Annualized Return [CAGR] From Jan. 2012 – Jun. 2024 (NAV) |
8.21% |
8.44% |
7.76% |
8.89% |
14.48% |
|
Max. Drawdown 2012 – Jun. 2024 (NAV) |
-18.92% |
-25.80% |
-26.51% |
-18.83% |
-23.95% |
|
Std. Deviation 2012 – Jun. 2024 (NAV) |
12.57% |
15.62% |
16.31% |
14.75% |
14.32% |
|
10-Year CAGR (Jun. 2014 – May 2024) |
7.61% |
6.69% |
6.20% |
9.00% |
12.54% |
|
5-Year CAGR |
9.76% |
4.66% |
3.90% |
7.94% |
15.65% |
|
3-Year CAGR |
3.84% |
2.94% |
1.62% |
7.00% |
9.41% |
|
1-Year CAGR |
12.07% |
8.94% |
15.85% |
15.84% |
28.01% |
|
Fees (excluding interest) |
1.07% |
1.04% (Interest extra) |
0.93% (Interest extra) |
0.09% |
0.09% |
|
Leverage |
0% |
27.7% |
19.5% |
0% |
0% |
|
No of holdings |
56 (excl. Options) |
136 |
60 |
32 |
504 |
|
Assets |
$515 Million |
$3.9 Billion |
$2.8 Billion |
$3.25 Billion |
$550 Billion |
|
Allocation |
Utility & Infra sector, 34% Overwritten (Options Calls) |
Utility, Energy, Communications sectors |
Utility, Comm., Energy sectors |
100% Utility sector ETF. |
Largest 500 US companies |
Note: Some data (e.g., number of holdings and leverage) may not be current).
In the above table, we have included the S&P 500 simply as a reference point; otherwise, it is not a benchmark for BUI. Especially during the past three years, the utility sector has vastly diverged from the S&P500.
However, more recently, there has been some recovery in the Utility sector. We also observe that BUI has lagged the pure play Utility ETF, XLU, in the past three years. Please keep in mind that BUI has much more diversified allocations than just utility companies. Secondly, it is a global fund, which can be a plus or minus depending on where in the cycle we are. Lastly, BUI writes call options on nearly 1/3rd of its assets to generate income and reduce volatility, but it does cap the upside of the overwritten securities. So, a comparison with XLU is not an apple-to-apple comparison.
We would like to add that XLU is a solid pure-play Utility ETF and can be a suitable alternative, except that it pays a much lower yield, just about 50% of what BUI pays. For this reason, BUI is a much better alternative for income investors. From a long-term perspective, BUI is likely to provide similar total returns as XLU but double the income; plus uses no leverage. So, in many ways, it appears to be an ideal income vehicle for conservative income investors.
Risk Factors:
Investors need to be aware of certain risk factors that are associated with this fund and CEFs in general. Risk factors could be summarized as follows:
- BUI is a Utility sector-specific fund. Even though it is diversified within the sector, it cannot escape the headwinds if the entire sector was facing challenges.
- The general risks, such as the geopolitical situation.
- There is still a possibility of the occurrence of a recession in 2024 or 2025, though most market participants are expecting a shallow one if that happens. During a recession, the utility sector is expected to have smaller draw-downs than the broader market, but there will be losses nonetheless. That said, this fund uses no leverage, which is a plus.
- Market risks: The S&P 500 has been making new highs on the back of large technology stocks and the AI-fueled boom. The utility sector has also been a beneficiary because of increased power demand, and we have seen some gains this year. The broader market certainly is expensive in many areas, especially due to some bubble-like actions with the AI (artificial intelligence) hype. A significant correction in the broader market will bring down all sectors with it.
Concluding Thoughts:
BUI fund currently offers a minimal discount of -1.15%; however, it has a reasonable level of income, roughly at 6.50%. For income investors who do not need very high income, it is a very good choice for the long term to represent the Utility sector, with predictable income and decent capital appreciation. Furthermore, the increasing power demand from the AI revolution and the lower interest rates going forward should act as tailwinds for the Utility sector in general. Patient investors can profit by playing it right while being paid for waiting. It is best to accumulate it on a dollar-cost-average basis. For existing investors with full positions, it is a “Hold.”
Editor’s Note: This article discusses one or more securities that do not trade on a major U.S. exchange. Please be aware of the risks associated with these stocks.



:max_bytes(150000):strip_icc()/roundup-writereditor-loved-deals-tout-f5de51f85de145b2b1eb99cdb7b6cb84.jpg)


