Bussiness
Bitcoin price prediction – Is $61,000 BTC’s next target on the charts?

- New and old Bitcoin supply revealed that the coin lacked new investors
- Long-term holders are selling – Sign of a further price decline
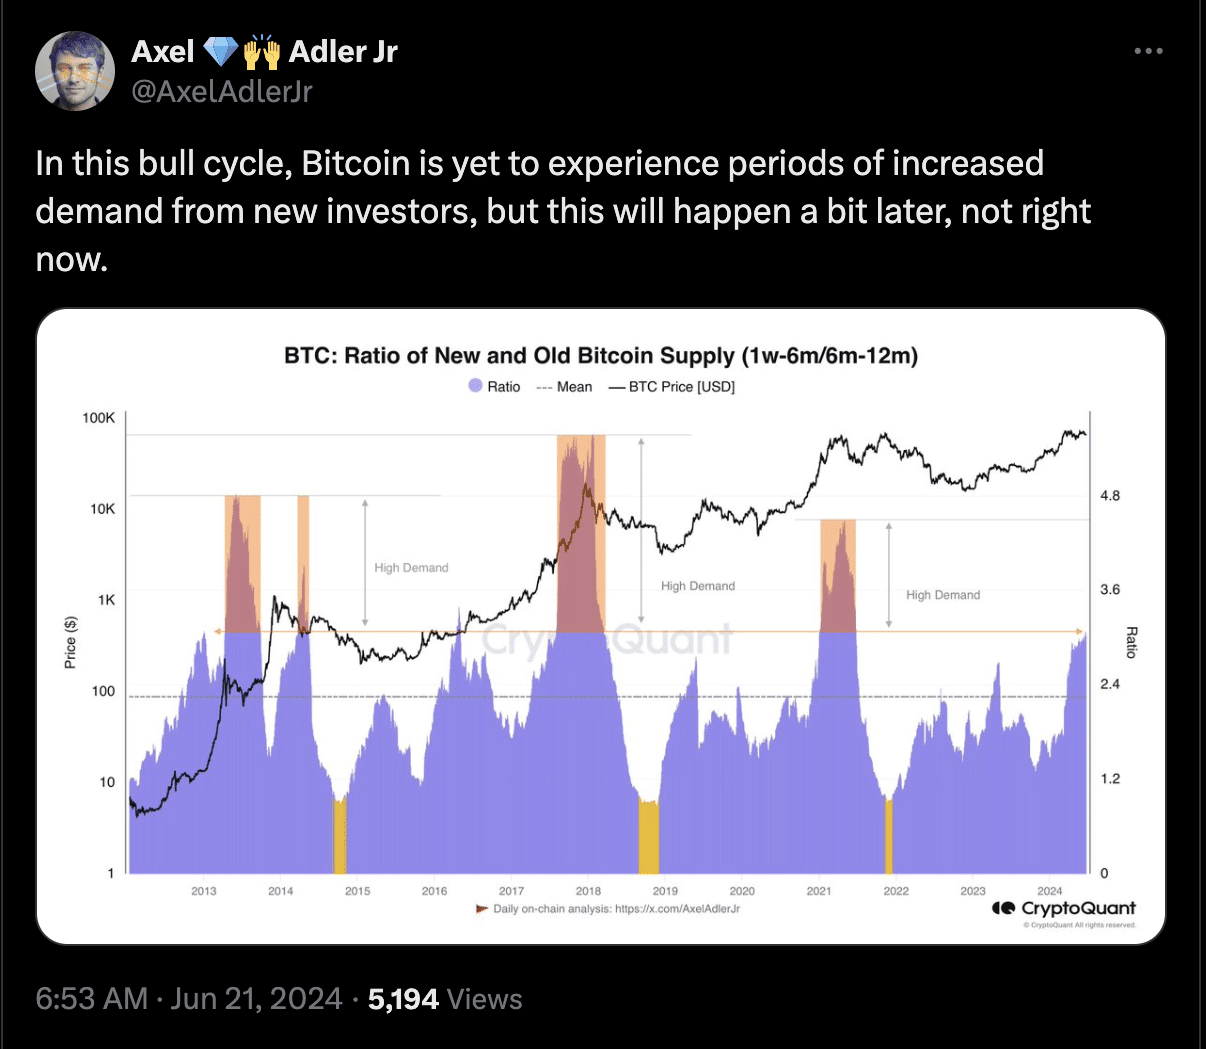
According to Axel Adler, an on-chain analyst, Bitcoin [BTC] is yet to hit its highest level of demand. According to him, this may be the case because the demand from new investors has been low, compared to previous bull markets.
However, Alder, in his post on X, also noted that new investors would begin to buy BTC at a much later date. Evidence of this opinion can be seen in the Ratio of Old and New Bitcoin Supply.
As can be seen in the chart below, Bitcoin is not yet close to the areas of high demand. Therefore, the chances of a price hike in the mid to long-term might be higher.
New investors are not around
At press time, Bitcoin’s price was $63,719 after falling by almost 5% in the last seven days. To ascertain if Bitcoin’s price will hike, AMBCrypto looked at user engagement and growth on the network
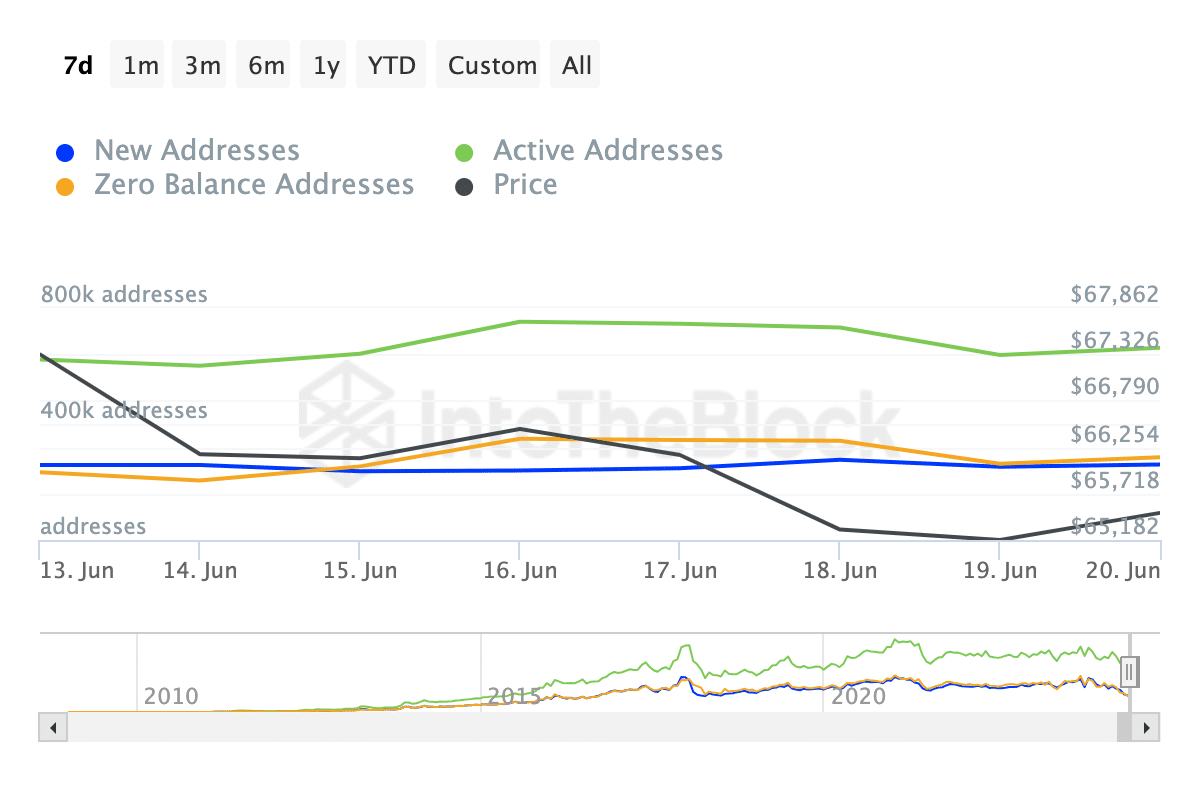
In the metric provided by IntoTheBlock, we have the new addresses, active addresses and zero-balance addresses. Active addresses measure the number of existing users transacting on the network.
New addresses, on the other hand, mean the number of addresses completing their first transaction. At press time, Bitcoin active addresses had risen by 6.47% in the last seven days.
Zero-balance addresses jumped by 22% while new addresses remained almost the same. The stagnancy in new addresses is a reflection of Adler’s opinion above. For the price, this could bring about another decrease.
Recently, AMBCrypto reported how an analyst predicted that the coin could drop to $54,000. While this might not happen in the short term, BTC can fall towards $61,000 on the charts.
Holders continue to sell
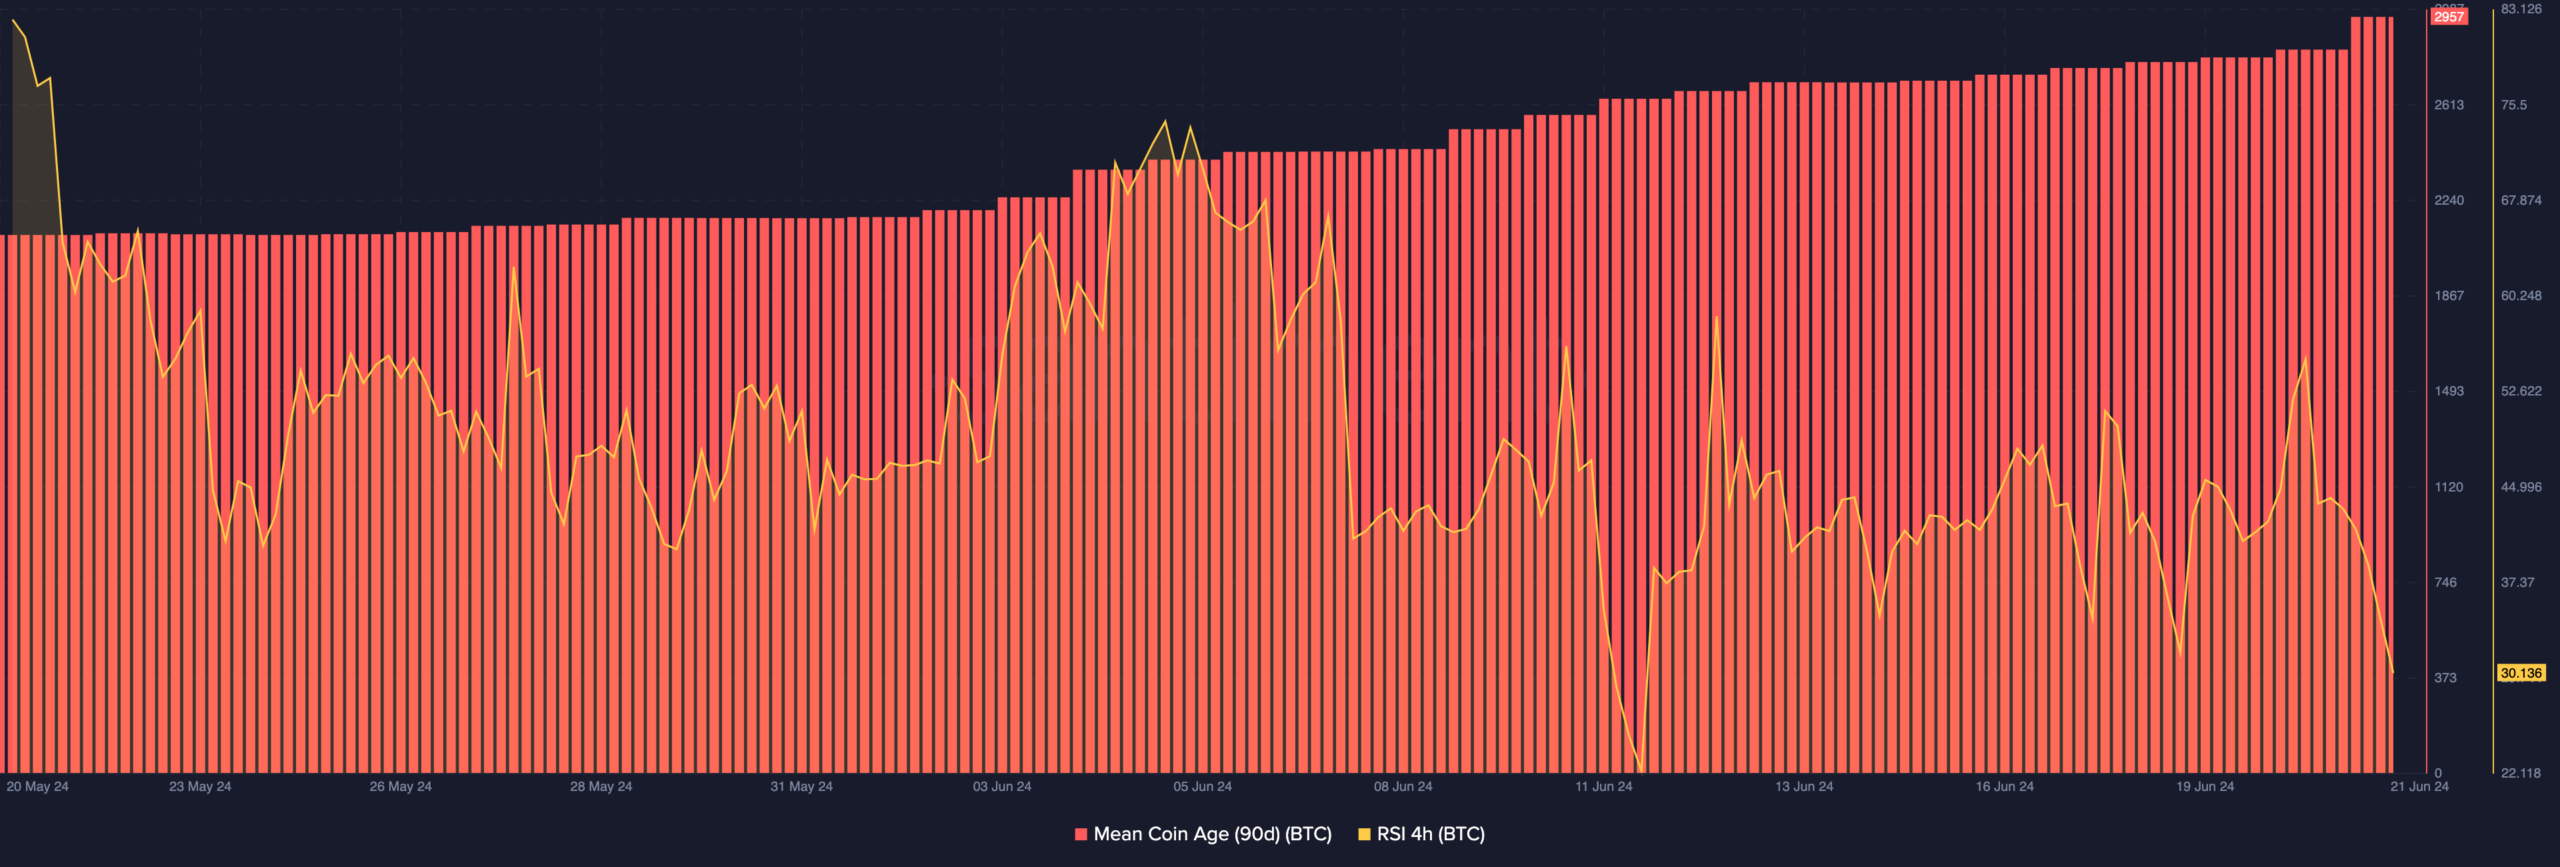
We also analyzed the Mean Coin Age (MCA). The MCA shows the average age of all coins based on the weighted purchase price. When the metric rises, it means that old coins are moving from their previous storage.
In most cases, this means that long-term holders are selling. However, when the MCA falls, it implies that holders of the coin do not want to sell. Instead, market participants are accumulating new coins and retiring them to a cold wallet.
At press time, Bitcoin’s 90-day MCA was still on its uptrend from 1 June. Should this go on, the price of the coin might drop, and the $61,000 prediction could become a reality.
In addition, the Relative Strength Index (RSI) on the 4-hour chart fell. The RSI is a technical oscillator that tracks an asset’s momentum.
It also tells us when a cryptocurrency is overbought or oversold. Values of 70 or above mean overbought while readings below 30 means oversold. At press time, Bitcoin’s RSI was close to the oversold region.
Is your portfolio green? Check the Bitcoin Profit Calculator
This indicates that momentum has been bearish. As such, a further price fall could be possible.
However, if buying pressure increases, the price might rebound. As far as demand is concerned, it might remain low for the next few weeks.


:max_bytes(150000):strip_icc()/roundup-writereditor-loved-deals-tout-f5de51f85de145b2b1eb99cdb7b6cb84.jpg)


